Thread on Volume Spread Analysis (VSA) of NIFTY(SPOT) in relation to trade activity that took place on 16/10/2019

If found useful "RT"

Tagging @prodigal_trader and @ST_PYI for their reviews
#nifty50 Image
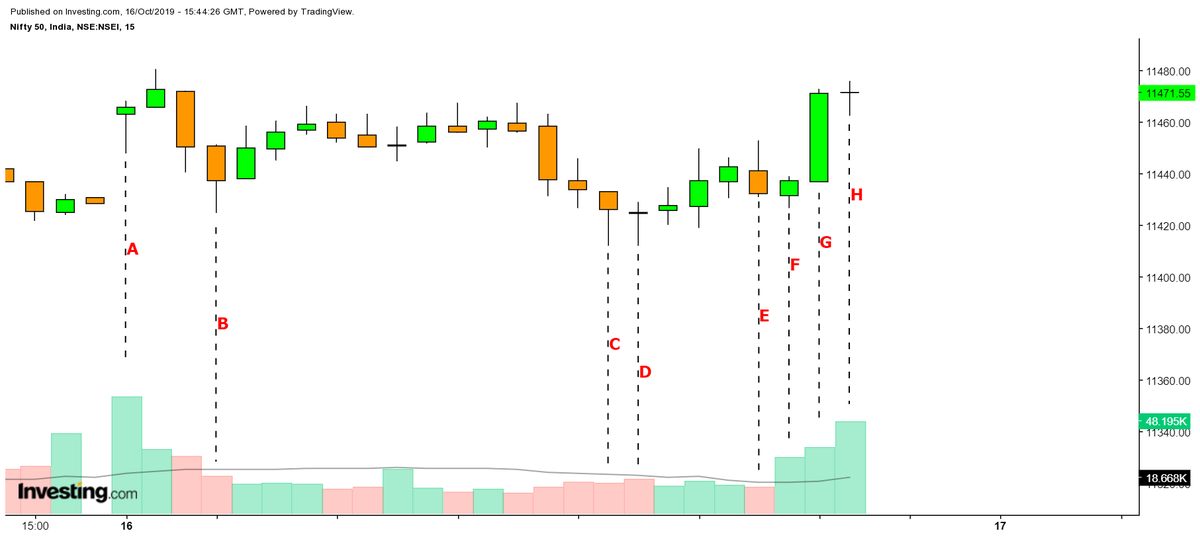
POINT-A: The day started with an UP-BAR and that too combined with GAP-UP which locked most of the traders who held SHORT trades from last trading session but remember this move was not enough because who has more money will always over-rule and thus SMART HANDS initiated "SELL"
Bars following POINT-A: If you have a question "Why SMART MONEY initiated SELL?", because they must have seen that still many RETAILERS are either holding SHORTS so to make them feel "complacent" and trap the FOMO RETAILERS who were left to "SHORT INDEX" and make them participate
POINT-B: This is "SIGN OF STRENGTH" because the SPREAD is good along with this operation is taking place at LOW VOLUMES which means it was more of "RETAILERS" who were getting into play and SMART HANDS were not interested in SELL SIDE trades and following bars we saw up moves
Cont..Bars following POINT-B: Due to selling absorption by SMART MONEY market almost reached that point from where market opened and it was RETAILERS who kept on SELLING because of feeling complacent and seeing the first hour play RETAILERS made up their mind that it SELL ON RISE
But if you see most of the bars following POINT-B you will find that most of the bars were not having "attractive spread" and "even if they were having attractive spread they were lacking in volumes"

Cont..
Classic example of "EFFORTS VS RESULTS" wherein RETAILERS are making EFFORTS to "drag the market" but "NO RESULTS"
There was NO RESULT because most of the SELL ORDERS were getting absorbed by SMART MONEY because see some of the bars are UP-BARS and DOWN-BARS "CLOSING" at MIDPOINT
POINT-C & POINT-D: See the bars are "CLOSING" at MID-POINT this is very conclusive to say that
"SMART MONEY" is doing two things
>ROTATING ORDERS which is giving a down tick to INDEX and "RETAILERS" feeling they are on CORRECT SIDE
>ACCUMULATING in bits and pieces
Bars following POINT-C & D are UP-BARS which is again indicative that ACCUMULATION is "GOING ON"and bar at POINT-E is DOWN-BAR but with certainly less volumes which means "LACK OF SUPPLY"
POINT-F//G//H: During the last 40-45 mins SMART MONEY came into play with more power and they were "ACCUMULATING" earlier and at this juncture also they "ACCUMULATED" a good chunk reason:
>UP-BARS with good SPREAD
>Volumes getting registered which are considerable
Thus following things are concluded:
>In today's session it was "RETAILERS" who were mostly taking the SELL SIDE
>There was LACK OF SUPPLY in the market
>The point from where SMART HANDS started "ACCUMULATING" in today's session they added more during the last hour
Also late comers were trapped on both ends i.e. FOMO SHORTS got trapped due to ABSORPTION BY SMART HANDS and FOMO LONGS got trapped due to LIQUIDATION BY SMART HANDS
>Learning: Never RUN behind PRICE let it come to your level and then trade and most importantly stick to your plan

• • •

Missing some Tweet in this thread? You can try to force a refresh
 

Keep Current with 𝗦𝗶𝗱𝗱𝗵𝗮𝗿𝘁𝗵

𝗦𝗶𝗱𝗱𝗵𝗮𝗿𝘁𝗵 Profile picture

Stay in touch and get notified when new unrolls are available from this author!

Read all threads

This Thread may be Removed Anytime!

PDF

Twitter may remove this content at anytime! Save it as PDF for later use!

Try unrolling a thread yourself!

how to unroll video
  1. Follow @ThreadReaderApp to mention us!

  2. From a Twitter thread mention us with a keyword "unroll"
@threadreaderapp unroll

Practice here first or read more on our help page!

More from @siddharth_2410

Jun 25, 2021
In this market environment, I think we all are encountering one simple problem. Breakouts are fizzling out so don't you think that we should have at least one method by which we can handle such fizzled breakouts and trade in the opposite direction

So let's take a deep dive
We all know that from failed moves come faster moves but the problem here is we just see the same happening on screen and are not able to capitalize on the same. See the below-attached image for few seconds I think you will get the tone of further discussion
If you have observed carefully you must have understood that these encircled regions are the 'FAILED BREAKOUTS'. Now you can take out your charts and find out such failed breakouts you will observe that when the price moves out of range

Cont..
Read 12 tweets
Jun 24, 2021
Do you want to create GOOGLE SHEET SCREENER which shows those stocks which are BREAKING OUT 20 DAY HIGH and 20 DAY LOW?

The concept propounded by SIR RICHARD DONCHIAN
Let's take a deep dive

If you find this interesting then feel free to TAG😁, LIKE👍 and RT♻
Donchain Channel is a very interesting Trend Following Tool which looks as shown below. The UPPER LINE is called UPPER BOUNDARY and the LOWER LINE is called LOWER BOUNDARY. Trades can be set up in two manners
1. Trend Continuation
2. Trend Fading(Turtle Soup - Ref. Street Smart)
The problem over is not the trading part the main problem is to screen out those stock during the market hour or EOD basis for figuring out those stocks which are breaking out of UB or LB. Google Sheets can do a fair amount of job in screening out those stocks
Read 9 tweets
May 24, 2020
LEARNING POST
[Refining your ENTRIES based on MARKET STRUCTURE]

In this post I will make an attempt to share a simple but effective way of getting into TRADE with LOW RISK

If you find it interesting feel free to "RT"

So let's get started
Most of the time when we want to trade LONG we generally look for a classical pattern of UPTREND i.e. HIGHER HIGH - HIGHER LOW which is the first confirmation to trade LONGS

(See the image for better understanding) Image
Secondly what we look for is we wait for the price to retrace to the zone where it prior faced RESISTANCE and now it will be acting as SUPPORT and from thereon we will initiate LONG based on the concept of ROLE REVERSAL / CHANGE OF POLARITY

A perfect sauce for "PULLBACK TRADING"
Read 7 tweets
May 23, 2020
Let's discuss about PRICE ACTION PATTERN which gets repeated again and again but that FEAR OF MISSING OUT (FOMO) over rides and people do wrong trade

In this post I will try to explain about human mindset when PRICE starts moving higher/lower
If you find this interesting
"RT"
See in this image you are able to see that price is moving higher from a zone which is marked with horizontal boundaries and from there price moves up without looking back
Let say in this manner that if this much PRICE ACTION is present in front of you where you will take a trade Image
Accordingly there will be two categories of traders
1. Those who will try to take trade at CMP
2. Those who are waiting for PRICE to retrace back to POINT-A and then take a trade

You know why people will be ready to take trade at CMP because of one simple reason "CONFIDENCE"
Read 14 tweets
Apr 10, 2020
LEARNING POST:
DEMAND-SUPPLY ZONE

In this is post I will make an attempt to explain DEMAND - SUPPLY ZONE. Before we proceed some basic idea about DEMAND-SUPPLY.

1. DEMAND > SUPPLY: Price will RISE
2. SUPPLY > DEMAND: Price will FALL
3. SUPPLY = DEMAND: Price will CONSOLIDATE
When the price RISES/FALLS there is an IMBALANCE which is created and if in this IMBALANCE DEMAND > SUPPLY then you will see PRICE WILL RISE. On the contrary if in this IMBALANCE SUPPLY > DEMAND then you will see PRICE WILL FALL.
There will a point of time when the MARKET WILL REACH AN EQUILIBRIUM POINT that is the point where DEMAND = SUPPLY and the PRICE starts CONSOLIDATING or the PRICE will start moving in a RANGE

Cont..
Read 20 tweets
Apr 8, 2020
LEARNING POST:
Normally I see many traders getting confused in deciding if its DISTRIBUTION/RE-ACCUMULATION. So let me make an attempt to explain how I panned myself in understanding the process of DISTRIBUTION.
Firstly its more important to know that every stock has FOUR PHASES Image
ACCUMULATION - MARKUP - DISTRIBUTION - MARK DOWN
(Refer the image for better understanding)

After the stock has gone passed through the phase of MARKUP it will set a PEAK (POINT-A) then the stock will move down and set a TROUGH(POINT-B).
Cont..
Up to POINT-B everything is going as usual and every body is thinking that the stock has retraced little bit and there is profit booking. But the actual part of analysis begins at POINT-C wherein you are able to see that the stock is not able to sustain above PEAK (POINT-A)
Cont.
Read 8 tweets

Did Thread Reader help you today?

Support us! We are indie developers!


This site is made by just two indie developers on a laptop doing marketing, support and development! Read more about the story.

Become a Premium Member ($3/month or $30/year) and get exclusive features!

Become Premium

Don't want to be a Premium member but still want to support us?

Make a small donation by buying us coffee ($5) or help with server cost ($10)

Donate via Paypal

Or Donate anonymously using crypto!

Ethereum

0xfe58350B80634f60Fa6Dc149a72b4DFbc17D341E copy

Bitcoin

3ATGMxNzCUFzxpMCHL5sWSt4DVtS8UqXpi copy

Thank you for your support!

Follow Us on Twitter!

:(