UPDATE ON MARKETS: Much better month for SA market indeed. FTSE/JSE All Share ended month 3.3% positive in Rand-terms. This brings the full 2019-year return in Rand to 12.1%. SA Property bucked local equity market’s trend, losing 2.1%. Local Bonds improved 1.9% over same period. 

Page 2/10
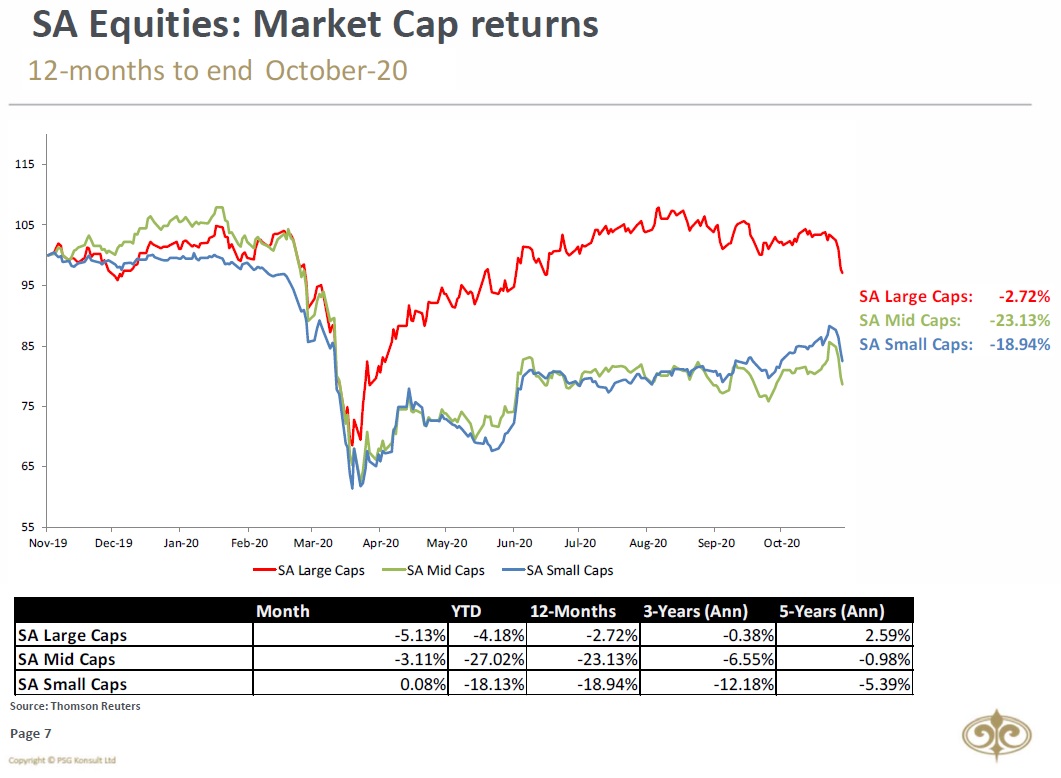
Mid-Caps was again the star performer in December, increasing by 4.7%. Large Caps also outperformed the JSE with a monthly return of 3.7%, while Small-Caps only improved by 0.2% over the same period.
Mid-Caps was again the star performer in December, increasing by 4.7%. Large Caps also outperformed the JSE with a monthly return of 3.7%, while Small-Caps only improved by 0.2% over the same period.

Page 3/10
What made performance even more extraordinary was that JSE outperformed MSCI All Country World Index (ACWI) significantly by 4.5% in USD during December & 0.6% against MSCI Emerging Market Index (EM). This however wasn’t enough to help outperform ACWI/EM over full 2019
What made performance even more extraordinary was that JSE outperformed MSCI All Country World Index (ACWI) significantly by 4.5% in USD during December & 0.6% against MSCI Emerging Market Index (EM). This however wasn’t enough to help outperform ACWI/EM over full 2019

Page 4/10
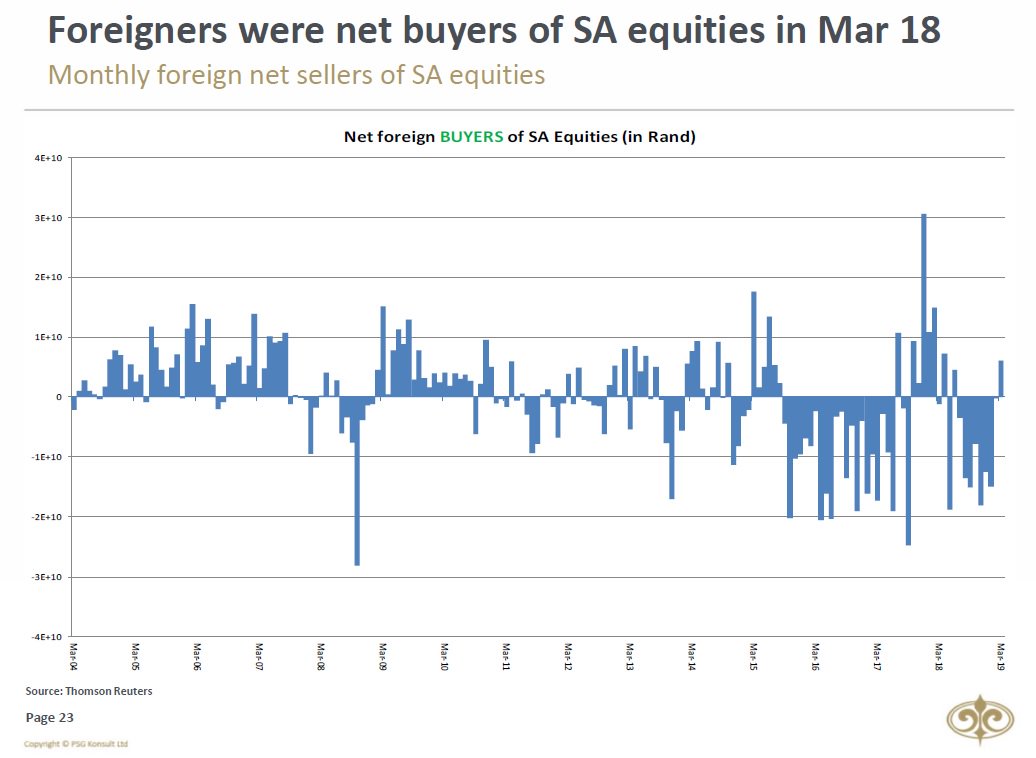
Despite strong performance, foreigners again were net sellers of SA Equities in December. This brings total net foreign outflow in SA Equities to R118bn for '19, with only 2 (out 12) months having net foreign buyers. Foreigner were however net buyers of SA Bonds in Dec
Despite strong performance, foreigners again were net sellers of SA Equities in December. This brings total net foreign outflow in SA Equities to R118bn for '19, with only 2 (out 12) months having net foreign buyers. Foreigner were however net buyers of SA Bonds in Dec

Page 5/10
From a sectoral perspective, Resources was the biggest driver of South African Equities in December, gaining 6.9%. Both Industrials (+2.5%) and Financials (+0.8%) underperformed the FTSE/JSE All Share over the same period.
From a sectoral perspective, Resources was the biggest driver of South African Equities in December, gaining 6.9%. Both Industrials (+2.5%) and Financials (+0.8%) underperformed the FTSE/JSE All Share over the same period.

Page 6/10
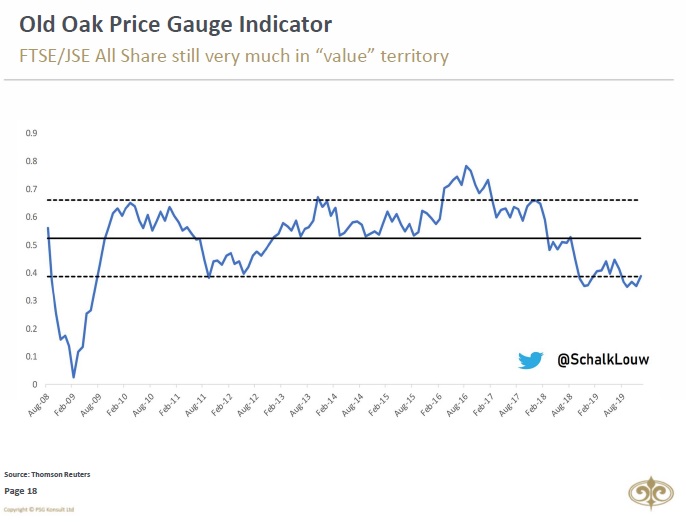
#PriceGauge indicator (using historic PE, DY & PB's ) on $JALSH reflects a fairly oversold Index. It historically gave a great indication on how cheap/expensive market can be perceived. Indicator still very much in “VALUE’ territory.
#PriceGauge indicator (using historic PE, DY & PB's ) on $JALSH reflects a fairly oversold Index. It historically gave a great indication on how cheap/expensive market can be perceived. Indicator still very much in “VALUE’ territory.
Page 7/10
South African Fear & Greed Index saw a strong move out of EXTREME FEAR territory in December.
South African Fear & Greed Index saw a strong move out of EXTREME FEAR territory in December.

Page 8/10
Rand enjoyed another great month in December, improving by nearly 5% against USD. This saw $ZAR end 2019 full-year, 2.6% stronger against USD. Many may argue that it was all due to USD weakness. This is however not case, as ZAR improved 5% against Euro in 2019 as well.
Rand enjoyed another great month in December, improving by nearly 5% against USD. This saw $ZAR end 2019 full-year, 2.6% stronger against USD. Many may argue that it was all due to USD weakness. This is however not case, as ZAR improved 5% against Euro in 2019 as well.

Page 9/10
SA Unit Trust sectors also enjoyed positive environment in Dec with SA General Equity Sector increasing 3.5% (+10.7% full 2019-year), SA Multi-Asset High Equity Sector improving 1.6% (+9.9% for '19) & SA Multi-Asset Low Equity Sector also improving 0.7% (+9.6% for '19)
SA Unit Trust sectors also enjoyed positive environment in Dec with SA General Equity Sector increasing 3.5% (+10.7% full 2019-year), SA Multi-Asset High Equity Sector improving 1.6% (+9.9% for '19) & SA Multi-Asset Low Equity Sector also improving 0.7% (+9.6% for '19)

Page 10/10 & Final
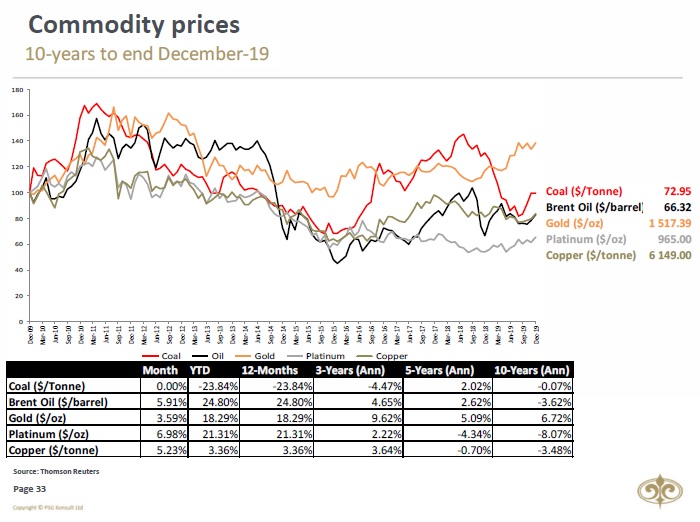
Commodities enjoyed biggest Santa-rally in years, with Platinum (+7%) being leader of pack. Both Brent Oil (+5.9%) & Copper (5.2%) weren’t too far behind in December.
Wishing you a 2020 that’s promising, exciting, inspiring and full of fun! Happy New Year!
Commodities enjoyed biggest Santa-rally in years, with Platinum (+7%) being leader of pack. Both Brent Oil (+5.9%) & Copper (5.2%) weren’t too far behind in December.
Wishing you a 2020 that’s promising, exciting, inspiring and full of fun! Happy New Year!
For those investors who’s got a keen interest on local version of Fear & Greed South Africa (☝🏼) Index, should be very careful when entering/buying any S&P500 investments currently. At 96 we’re not only talking about “EXTREME GREED”, but also highest #greed levels since end 2017.

• • •
Missing some Tweet in this thread? You can try to
force a refresh