UPDATE ON MARKETS: What a month! FTSE/JSE All Share improved by 10.5% during November, following 4.7% contraction during Oct & 1.6% decline in Sep. SA Property stocks made 17.5% recovery during Nov, bringing YTD performance to -43.6%. SA All Bond Index increased by 3.3% for month 

2/13
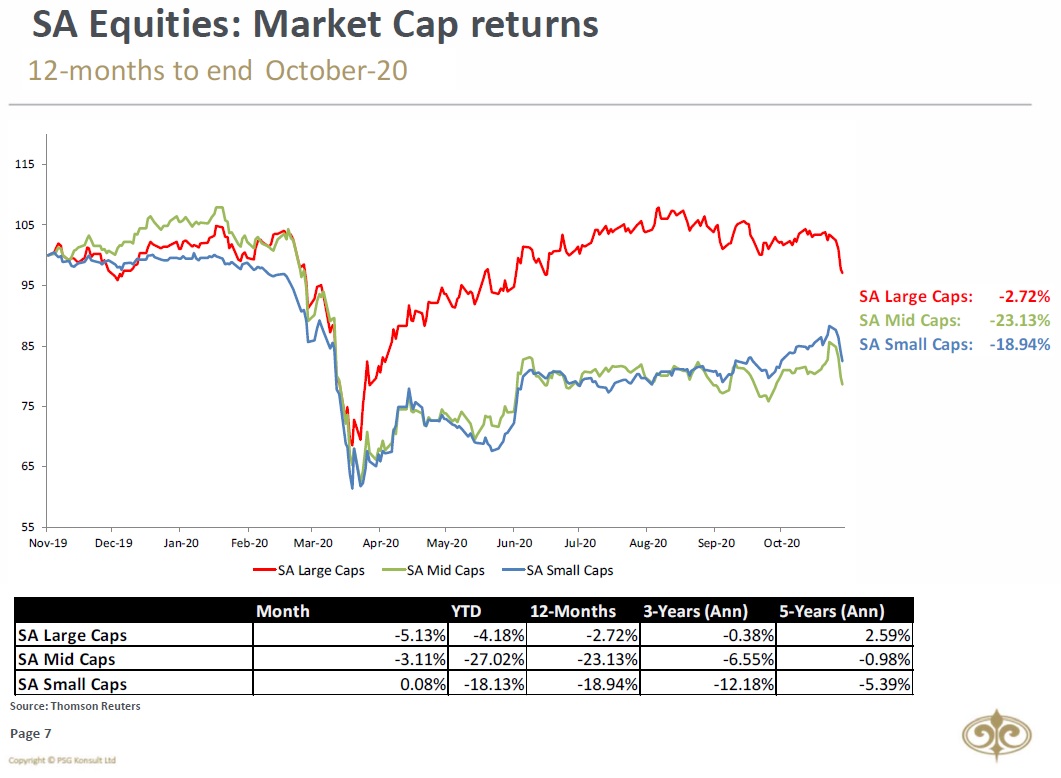
South African Small Caps continued to perform well during November, growing by 15.56%. Mid-Caps and Large Caps grew by 10.05% and 10.37% respectively.
South African Small Caps continued to perform well during November, growing by 15.56%. Mid-Caps and Large Caps grew by 10.05% and 10.37% respectively.

3/13
FTSE/ JSE All Share ( $JALSH) again enjoyed a better month than the #MSCI All Country World Index in USD terms. The YTD performance for the JSE in USD-terms was -7.12% versus the MSCI ACWI’s performance of 11.10%.
FTSE/ JSE All Share ( $JALSH) again enjoyed a better month than the #MSCI All Country World Index in USD terms. The YTD performance for the JSE in USD-terms was -7.12% versus the MSCI ACWI’s performance of 11.10%.

4/14
Nothing like a bit of GREED to take us into December! #FearandGreed #SouthAfrica #Index moving back closer to greed territory. For those followers who'd like to get more information on the Fear & Greed South African Index, can click here: oldoak.co.za/wp/index.php/2…
Nothing like a bit of GREED to take us into December! #FearandGreed #SouthAfrica #Index moving back closer to greed territory. For those followers who'd like to get more information on the Fear & Greed South African Index, can click here: oldoak.co.za/wp/index.php/2…

5/14
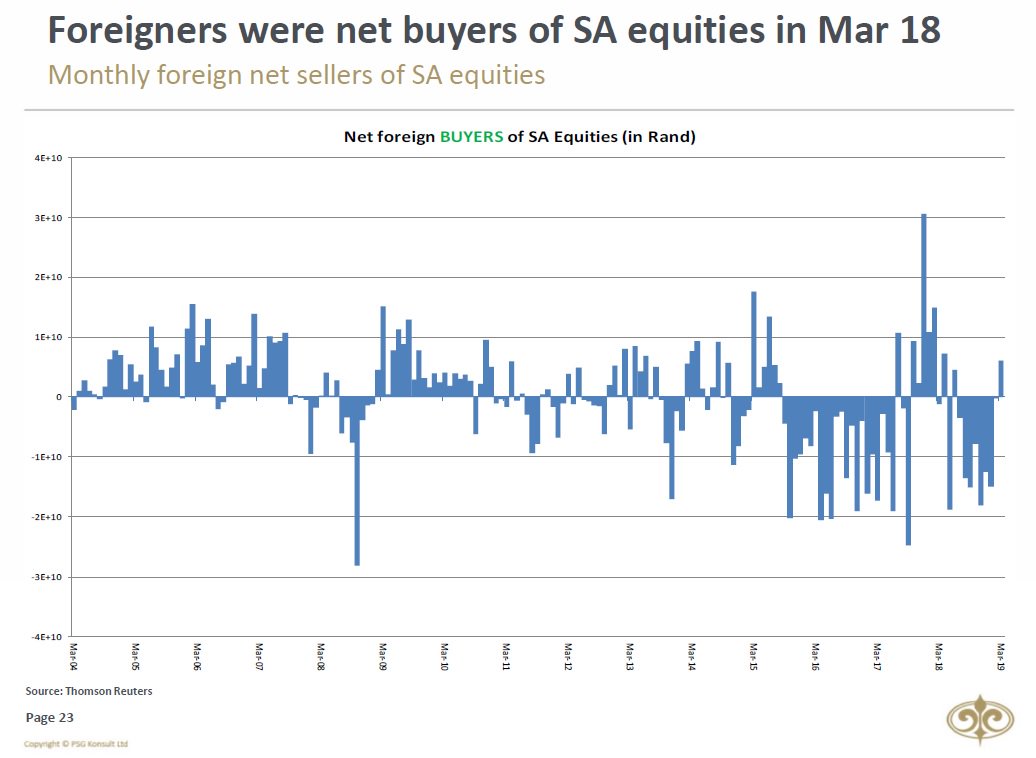
Foreigners have been net sellers of SA Equities for 17 months in a row. There's however GOOD NEWS! During November, foreigners were net buyers of SA Bonds.
Foreigners have been net sellers of SA Equities for 17 months in a row. There's however GOOD NEWS! During November, foreigners were net buyers of SA Bonds.

6/13
From a sectoral point of view, November saw the Financial and Resource sectors improve by 18.02% and 11.38% respectively
From a sectoral point of view, November saw the Financial and Resource sectors improve by 18.02% and 11.38% respectively

7/13
SA Inc/ Banks made a significant comeback during November, while gold was the biggest loser for the month
SA Inc/ Banks made a significant comeback during November, while gold was the biggest loser for the month

8/13
Rand enjoyed a very strong month, improving by 5.03% against USD. It gained 2.55% in November 2020 against Euro & 2.03% against Pound. Very interesting point to mention is also that $ZAR moved up to 2nd best performing #BRICS currency over 5yr rolling period in November.
Rand enjoyed a very strong month, improving by 5.03% against USD. It gained 2.55% in November 2020 against Euro & 2.03% against Pound. Very interesting point to mention is also that $ZAR moved up to 2nd best performing #BRICS currency over 5yr rolling period in November.

9/13
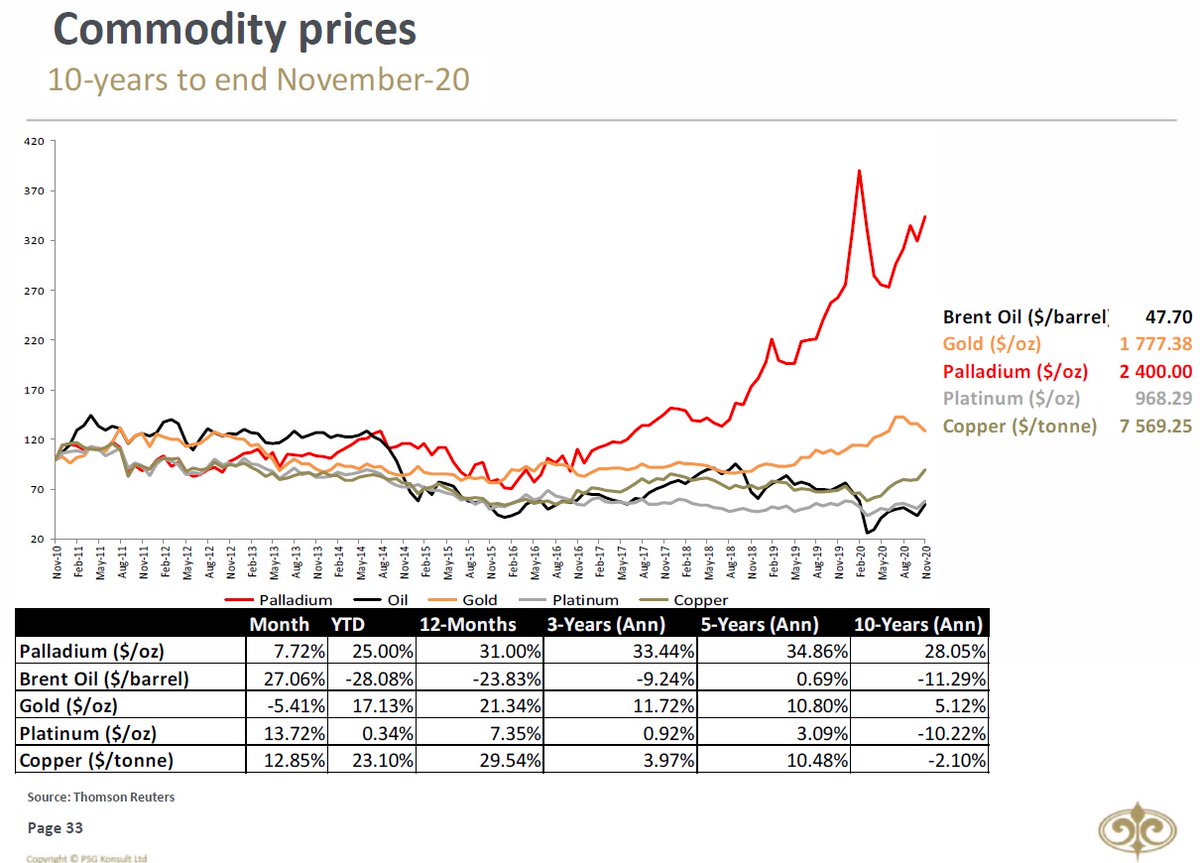
Most commodities recovered during November. With the prospect of COVID-19 vaccines, Oil saw an improvement of 27.06% for the month. Platinum grew by 13.72% during November, followed by Copper which increased by 12.85%.
Most commodities recovered during November. With the prospect of COVID-19 vaccines, Oil saw an improvement of 27.06% for the month. Platinum grew by 13.72% during November, followed by Copper which increased by 12.85%.
10/13
#Active managers outperformed their #passive counterparts on average again during November! SA General Equity Unit Trust Sector was up by 11.50% during November, while the SA Multi-Asset High Equity & Low Equity Sectors grew by 7.32% and 3.94% respectively, for the month.
#Active managers outperformed their #passive counterparts on average again during November! SA General Equity Unit Trust Sector was up by 11.50% during November, while the SA Multi-Asset High Equity & Low Equity Sectors grew by 7.32% and 3.94% respectively, for the month.

11/13
Yet again, the US M2 Money Supply YoY growth rate reached a new all-time high for the sixth time in 2020 during October.
Yet again, the US M2 Money Supply YoY growth rate reached a new all-time high for the sixth time in 2020 during October.

12/13
The US Dollar Index is trading below its downward-sloping 200-day Moving Average, and 50-day Moving Average.
The US Dollar Index is trading below its downward-sloping 200-day Moving Average, and 50-day Moving Average.

13/13 & Final
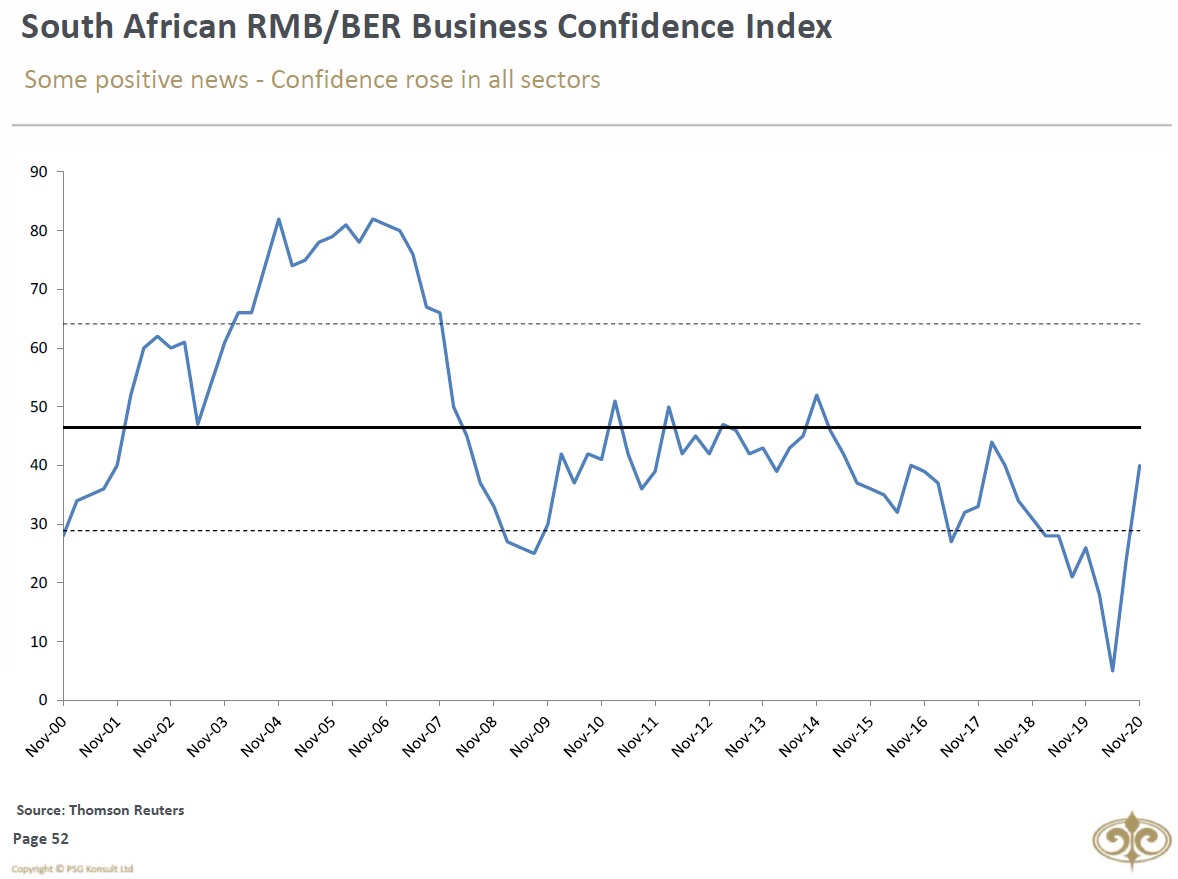
And to end off a "feel good" month, the South African RMB/BER Business Confidence Index rose to levels last seen in 2017.
And to end off a "feel good" month, the South African RMB/BER Business Confidence Index rose to levels last seen in 2017.
Unroll @threadreaderapp
• • •
Missing some Tweet in this thread? You can try to
force a refresh