
TAXES & DEBT
@KeTreasury’s forecasting total tax collection of KES 1 771.4 Billion by end June. By end March, tax collections stood at KES 1 119.99 Billion.
How can KRA can magically raise KES 651 Billion Shillings in April, May and June. Seriously?
[2/n]
@KeTreasury’s forecasting total tax collection of KES 1 771.4 Billion by end June. By end March, tax collections stood at KES 1 119.99 Billion.
How can KRA can magically raise KES 651 Billion Shillings in April, May and June. Seriously?
[2/n]
That’s approximately KES 217 Billion, each month, or nearly twice the average monthly collection [KES 124 Billion] between July 2019 and March 2020.
From an economy where consumer spending has drastically contracted. In the middle of a pandemic.
[3/n]
From an economy where consumer spending has drastically contracted. In the middle of a pandemic.
[3/n]
This is...odd. @KNBStats put some old data into this report, despite the document coming out when the tax target, public debt, and debt service numbers have all been changed. Changed several times, in fact.
[4/n]
[4/n]
For instance, KNBS still cites an old tax revenue target of KES 1 771.4 Billion Shillings. Original target, according to the @KeTreasury, was KES 1 807.648 Billion, which was then slashed to KES 1 704.951 Billion.
[5/n]
[5/n]
Debt service costs were also revised in 2nd Supplementary Budget to KES 778.847 Billion. To say “KES 640.8 billion is expected to be spent on public debt servicing”, as this report does is inaccurate. The former number is 21% higher than what KNBS is citing here.
[6/n]
[6/n]
Given that most of this data was available in the last fortnight or so, it is rather odd that the 2020 Survey shipped with out-of-date data in it.
[7/n]
[7/n]
INTERNET CONNECTIONS
Total wired internet subscriptions rose by 40.9% to 427 700 largely due to growth of fixed fiber optic links [+52.9% to 268 800 in 2019]. Likely Safaricom bulking up its FTTH ? Sounds like it at this point, but I’m in the early stages of the report.
[8/n]
Total wired internet subscriptions rose by 40.9% to 427 700 largely due to growth of fixed fiber optic links [+52.9% to 268 800 in 2019]. Likely Safaricom bulking up its FTTH ? Sounds like it at this point, but I’m in the early stages of the report.
[8/n]
HEALTH DATA
Some of this is still as grim as ever. Respiratory ailments, “continued to be the leading cause of outpatient disease incidence reported in public health facilities.
[9/n]
Some of this is still as grim as ever. Respiratory ailments, “continued to be the leading cause of outpatient disease incidence reported in public health facilities.
[9/n]
Pneumonia remained the leading cause of infants and children under-five admissions to health facilities for the period 2017 to 2019.”
[10/n]
[10/n]
At the very least, the first headline number infers that we have a serious air quality problem which the relevant authorities are blissfully ignoring.
[11/n]
[11/n]
FOSSIL FUELS
On the plus side, LPG consumption more than doubled between 2015 and 2019 to over 312 000 tonnes last year. But is it rising fast enough to offset wood-fuel use? Just using the respiratory illness data as a proxy, the answer might be no.
[12/n]
On the plus side, LPG consumption more than doubled between 2015 and 2019 to over 312 000 tonnes last year. But is it rising fast enough to offset wood-fuel use? Just using the respiratory illness data as a proxy, the answer might be no.
[12/n]
Kerosene consumption absolutely cratered in 2019 though, down 50.4% to 168 300 tonnes. 2nd straight year of decline. Effect of the anti-adulteration levy, perhaps?
[13/n]
[13/n]
Comparative consumption changes, 2015-2019:
Diesel: +5.66% to 2 198 700 tonnes.
Petrol: +29.6% to 1 434 300 tonnes.
Jet fuel: +10.15 to 699 400 tonnes.
[14/n]
Diesel: +5.66% to 2 198 700 tonnes.
Petrol: +29.6% to 1 434 300 tonnes.
Jet fuel: +10.15 to 699 400 tonnes.
[14/n]
4 year streak of rising value in imported petroleum products ended in 2019 with a 3% decline. $/KES rate was stable [now that we have a managed float] that year, & oil prices didn’t whip around much either [started around $ 57/bbl closed 2019 at around $ 64/bbl]. 🤔
[15/n]
[15/n]
In terms of volumes consumed, fuel consumption rose marginally [+0.34%]. Can’t be that Kenyans are driving less [we import tens of thousands of vehicles each month]. Maybe we’re importing more fuel efficient vehicles instead?
[16/n]
[16/n]
LABOR MARKET
Formal sector job creation [both public and private] was at a *5-year low*.
Just 78 400 new jobs created in 2019. Bulk of that was because of a 19.96% fall in private sector job creation:
2018: 57 600
2019: 46 100
[17/n]
Formal sector job creation [both public and private] was at a *5-year low*.
Just 78 400 new jobs created in 2019. Bulk of that was because of a 19.96% fall in private sector job creation:
2018: 57 600
2019: 46 100
[17/n]
Ah, #Kenya: fancy GDP growth numbers obscure much . Ideally, if growth numbers are strong, new jobs data should rise in tandem, not falling. If firms are not hiring, either:
[1] they can’t.
[2] they’ve replaced labor with capital, i.e. automated/out-sourced jobs.
[18/n]
[1] they can’t.
[2] they’ve replaced labor with capital, i.e. automated/out-sourced jobs.
[18/n]
IMO, the former is far more likely than the latter. Job culling due to robots isn’t exactly a big thing in an economy as Agriculture and Services dependent as we are.
[19/n]
[19/n]
Kenya, 2019:
Estimated real earnings per employee:
Private Sector: KES 31 812
Public Sector: KES 31 562
Nominal wage growth, y/y: +8.1%
Real wage growth [ex. Inflation] +2.3%.
Slower rate than 2018, when real wage growth was 3.2%.
[20/n]
Estimated real earnings per employee:
Private Sector: KES 31 812
Public Sector: KES 31 562
Nominal wage growth, y/y: +8.1%
Real wage growth [ex. Inflation] +2.3%.
Slower rate than 2018, when real wage growth was 3.2%.
[20/n]
So job creation is slowing down, and when your income rises, inflation is taking off a big chunk of it. Deeply frustrating.
[21/n]
[21/n]
The women-men split in the formal labor force: Of the 2.928 million people in wage employment, 1.888 Million were men, 1.040 million were women.
But, when you look at @NSSF_ke data, there is a massive divergence: 1.2 million women, compared to 3 million men. Why?
[22/n]
But, when you look at @NSSF_ke data, there is a massive divergence: 1.2 million women, compared to 3 million men. Why?
[22/n]
Or is this a legacy issue, from decades when the “formal” labor force was mostly male dominated?
[23/n]
[23/n]
MEDIA EVISCERATION
Headline numbers on the news business also make for deeply grim reading. 2019 had yet another year-on-year fall, but that’s not where the story is, in my view. *All* newspaper circulation categories have fallen steeply, between 2015 and 2019:.
[24/n]
Headline numbers on the news business also make for deeply grim reading. 2019 had yet another year-on-year fall, but that’s not where the story is, in my view. *All* newspaper circulation categories have fallen steeply, between 2015 and 2019:.
[24/n]
How bad, you ask? *This* bad:
Daily English Papers: -20.9% to 77.9 million copies, p.a.
Daily Swahili Papers: -25.2% to 3.896 million copies, p.a.
[25/n]
Daily English Papers: -20.9% to 77.9 million copies, p.a.
Daily Swahili Papers: -25.2% to 3.896 million copies, p.a.
[25/n]
It isn’t that the readers have evaporated. It’s that they’re now consuming a lot more of the same content online.
Way more. From the same media houses, via KNBS, average online visitors per day in 2019 rose by +84% to 2.91 million.
[26/n]
Way more. From the same media houses, via KNBS, average online visitors per day in 2019 rose by +84% to 2.91 million.
[26/n]
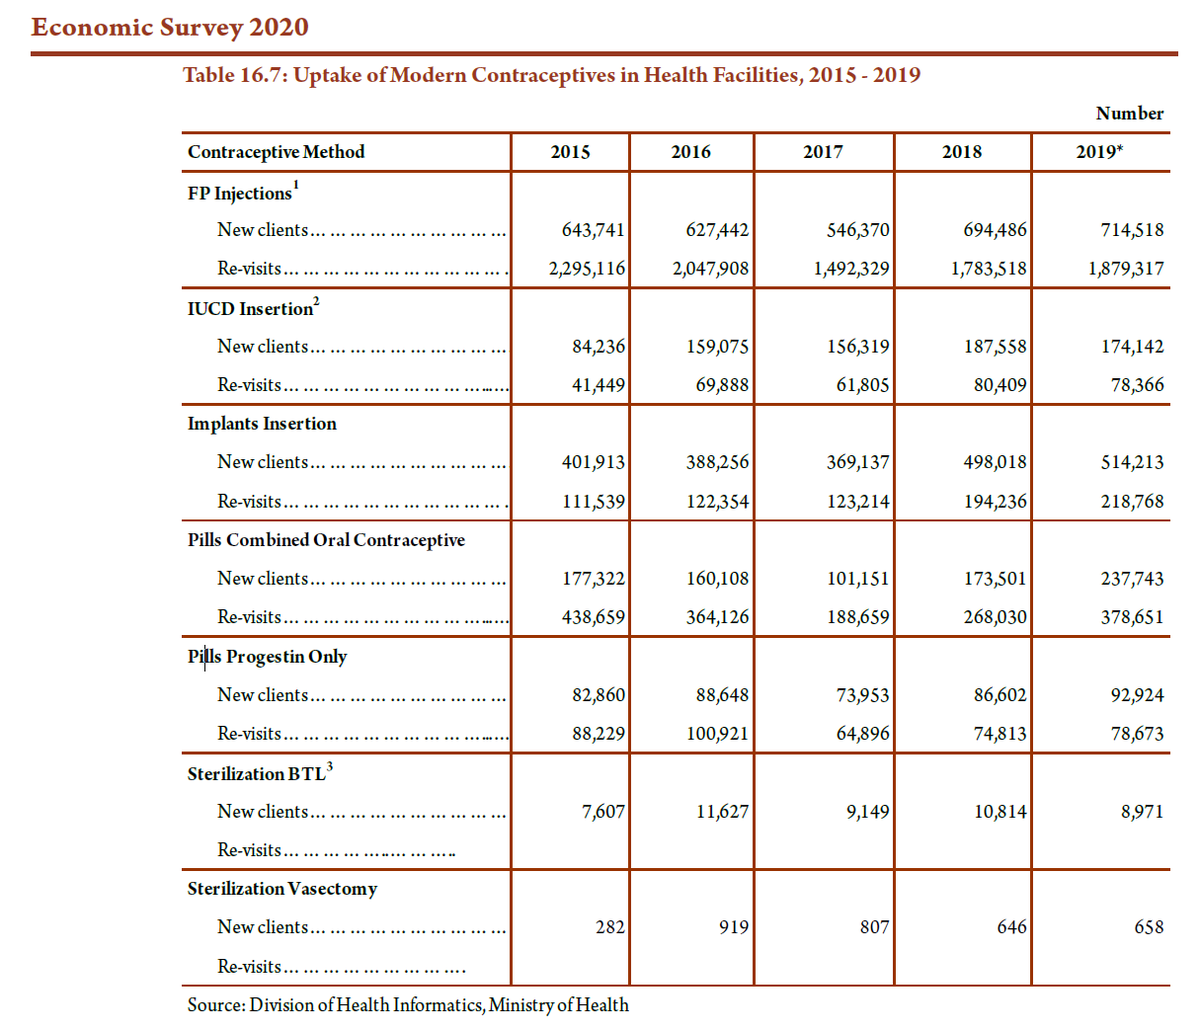
CONTRACEPTIVE USE
658 men had a vasectomy done in 2019, ~ 30% less than the 2016 number.
Number of women opting for tubal ligation? 8971 in 2019. -22.8% than 2016’speak, but way, way more than men opting for a permanent means of fertility control, by 13-to-1.
[27/n]
658 men had a vasectomy done in 2019, ~ 30% less than the 2016 number.
Number of women opting for tubal ligation? 8971 in 2019. -22.8% than 2016’speak, but way, way more than men opting for a permanent means of fertility control, by 13-to-1.
[27/n]
If there’s one data point to demonstrate the unequal burden of reproductive health care in Kenya, this is certainly one. Other contraceptive options and their use over 5-years, summarized below, via @MOH_Kenya data:
[28/n]
[28/n]
Still, what did happen in 2016, and why did the numbers fall in this category after this?
The @MOH_Kenya data in the survey didn’t have an age breakdown [this report is a summary, after all]. 2019’s Statistical Abstract may certainly have it, but that’s not out yet.
[29/n]
The @MOH_Kenya data in the survey didn’t have an age breakdown [this report is a summary, after all]. 2019’s Statistical Abstract may certainly have it, but that’s not out yet.
[29/n]

