A thread. 👇
Wiki: "A time series is a series of data points indexed (or listed or graphed) in time order." - en.wikipedia.org/wiki/Time_seri…

Deep-dive-material:
medium.com/@100trillionUS…
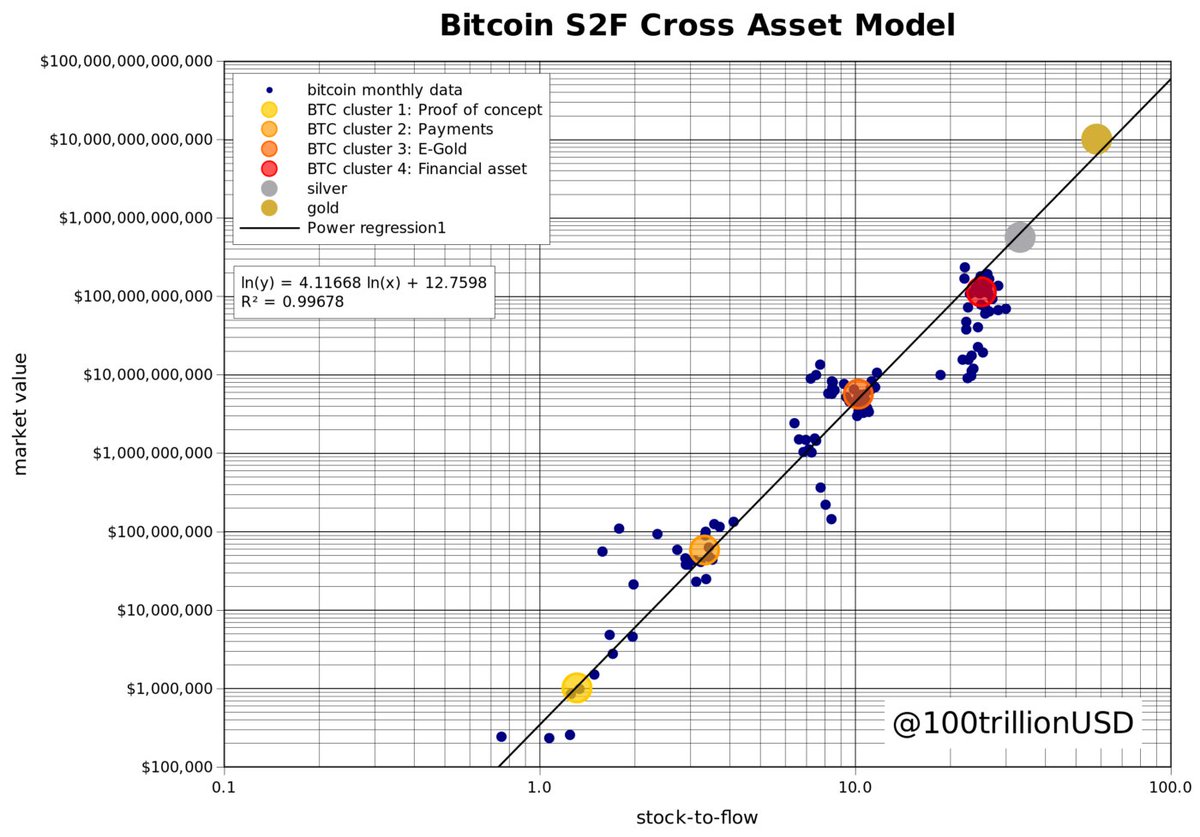
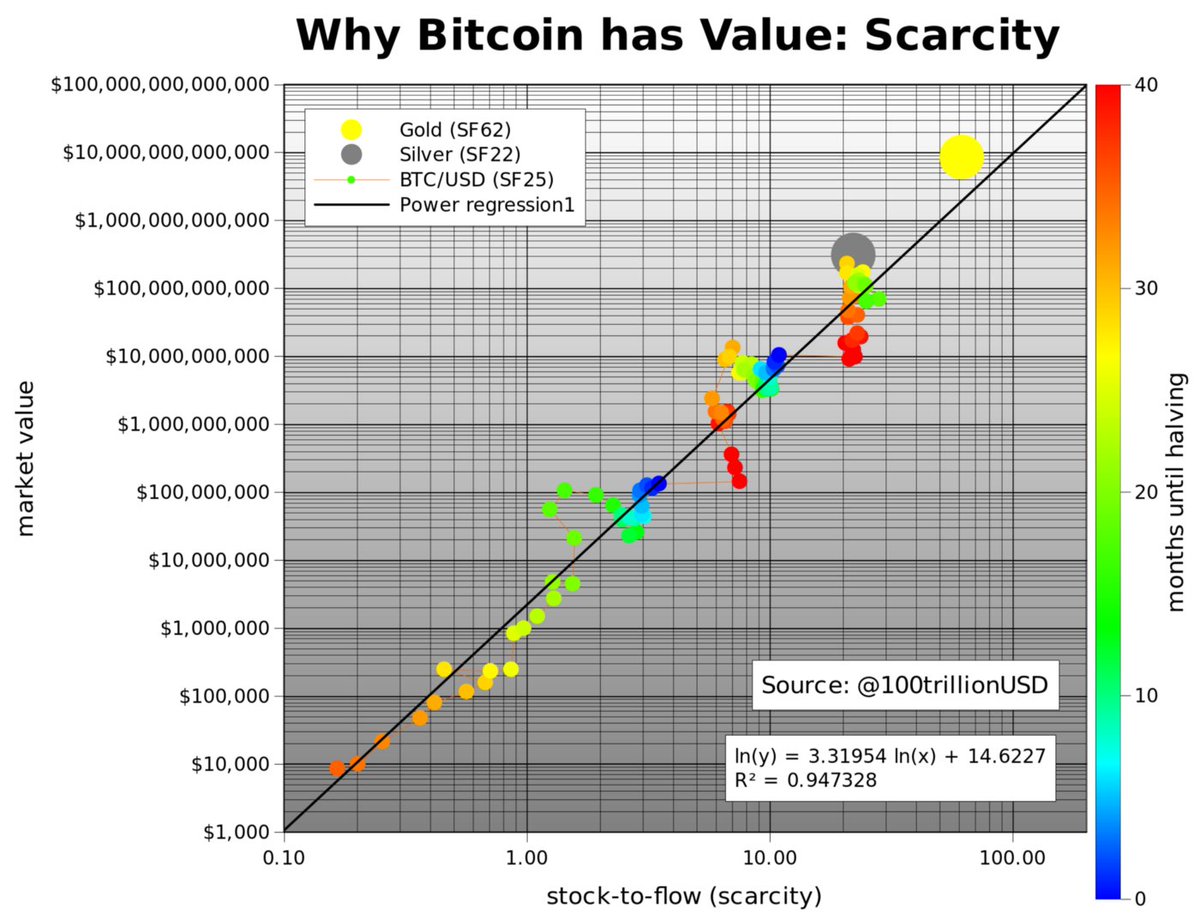
Could the relation between #Bitcoin's S2F & price also be spurious?
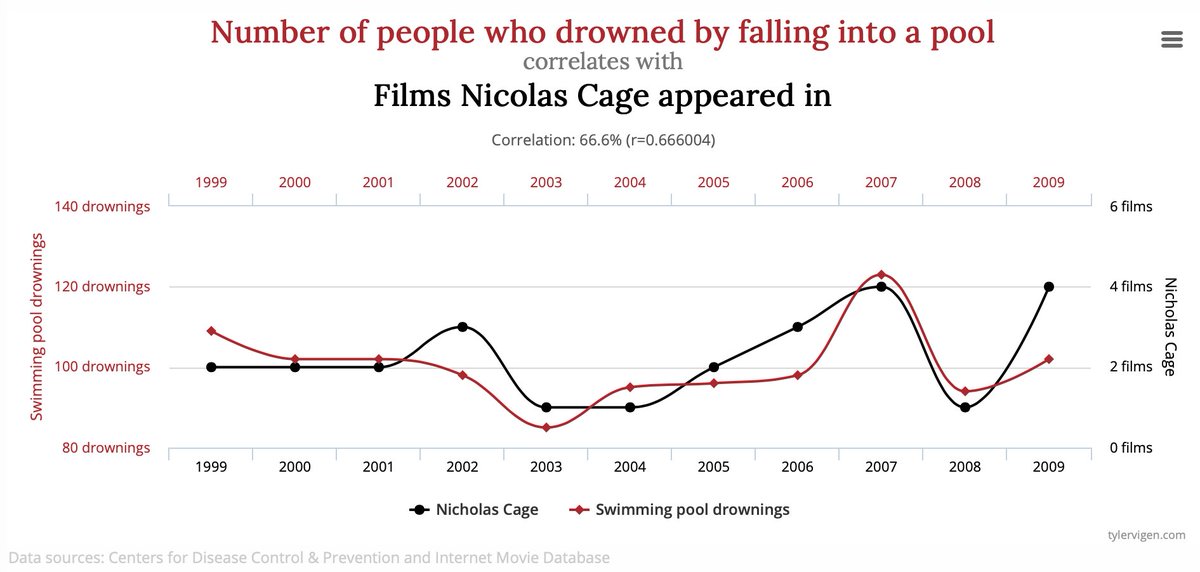
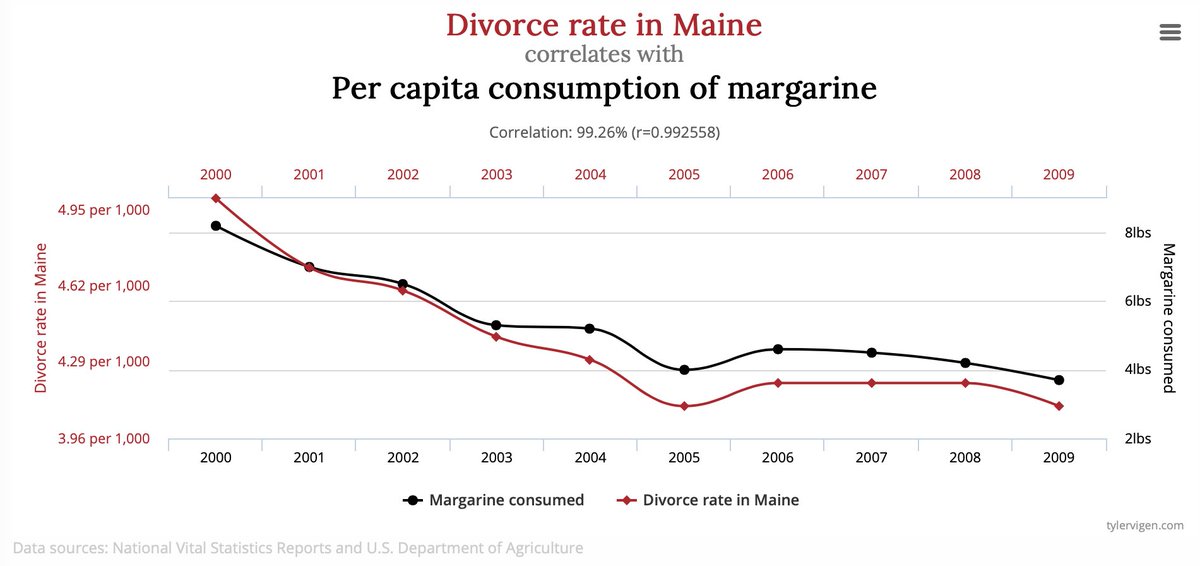
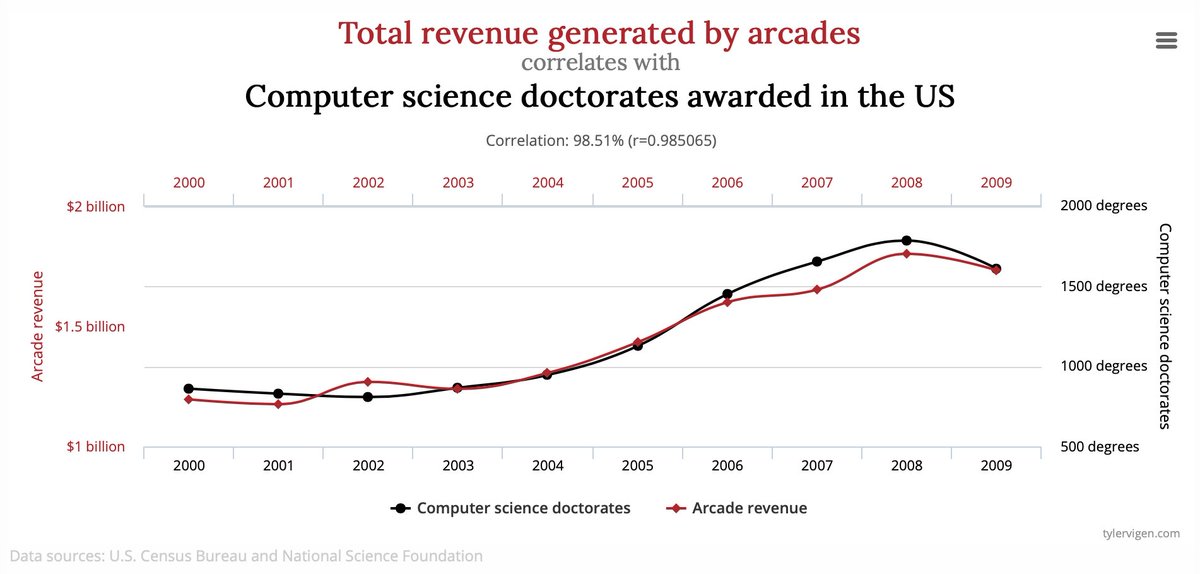
... what? 🤔
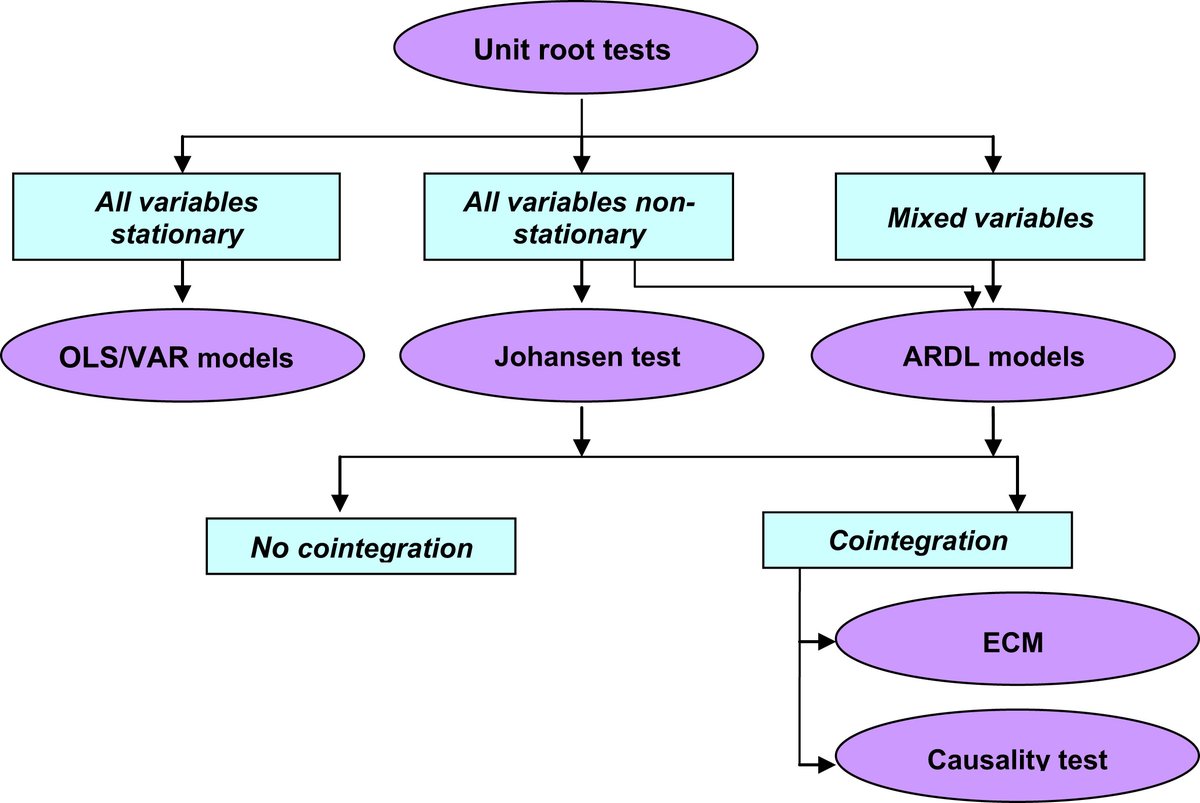
Wikipedia: "Cointegration is a statistical property of a collection of time series variables." - en.wikipedia.org/wiki/Cointegra…
In #Bitcoin's S2F model, both S2F & price are time series variables.
medium.com/@btconometrics…
medium.com/burgercrypto-c…
For a full summary of that, see this thread:
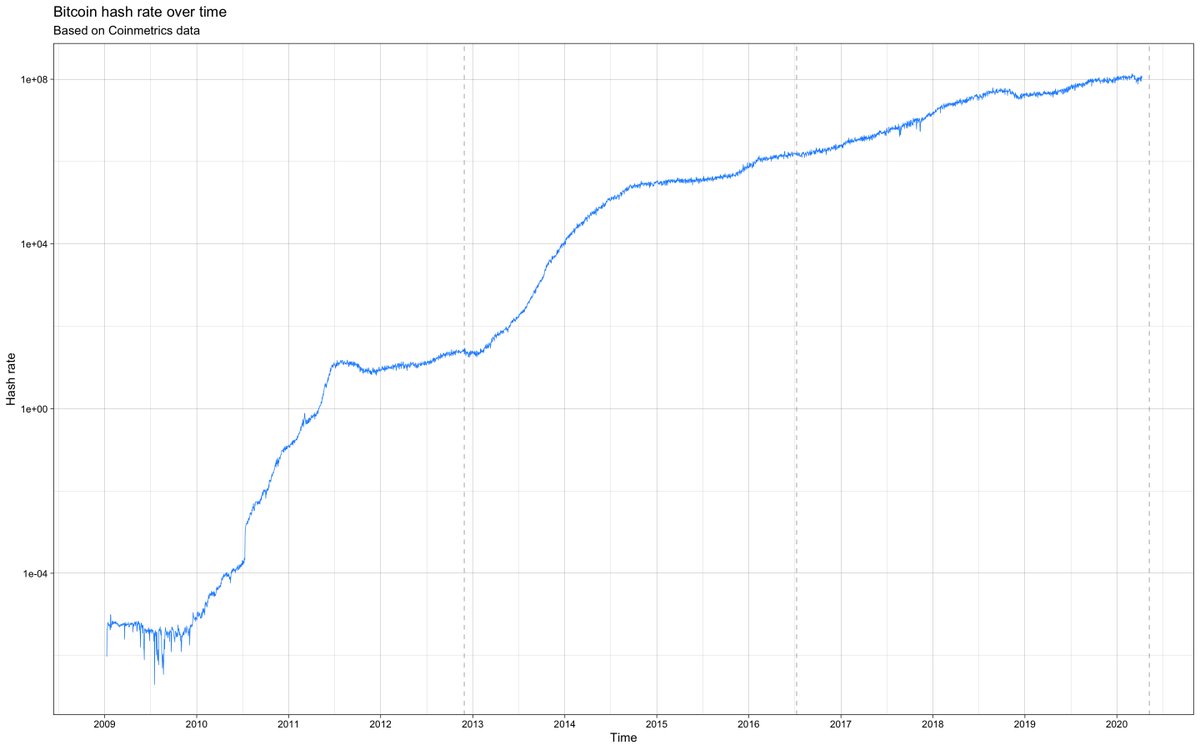
"A stationary process has the property that the mean, variance and autocorrelation structure do not change over time." - itl.nist.gov/div898/handboo…
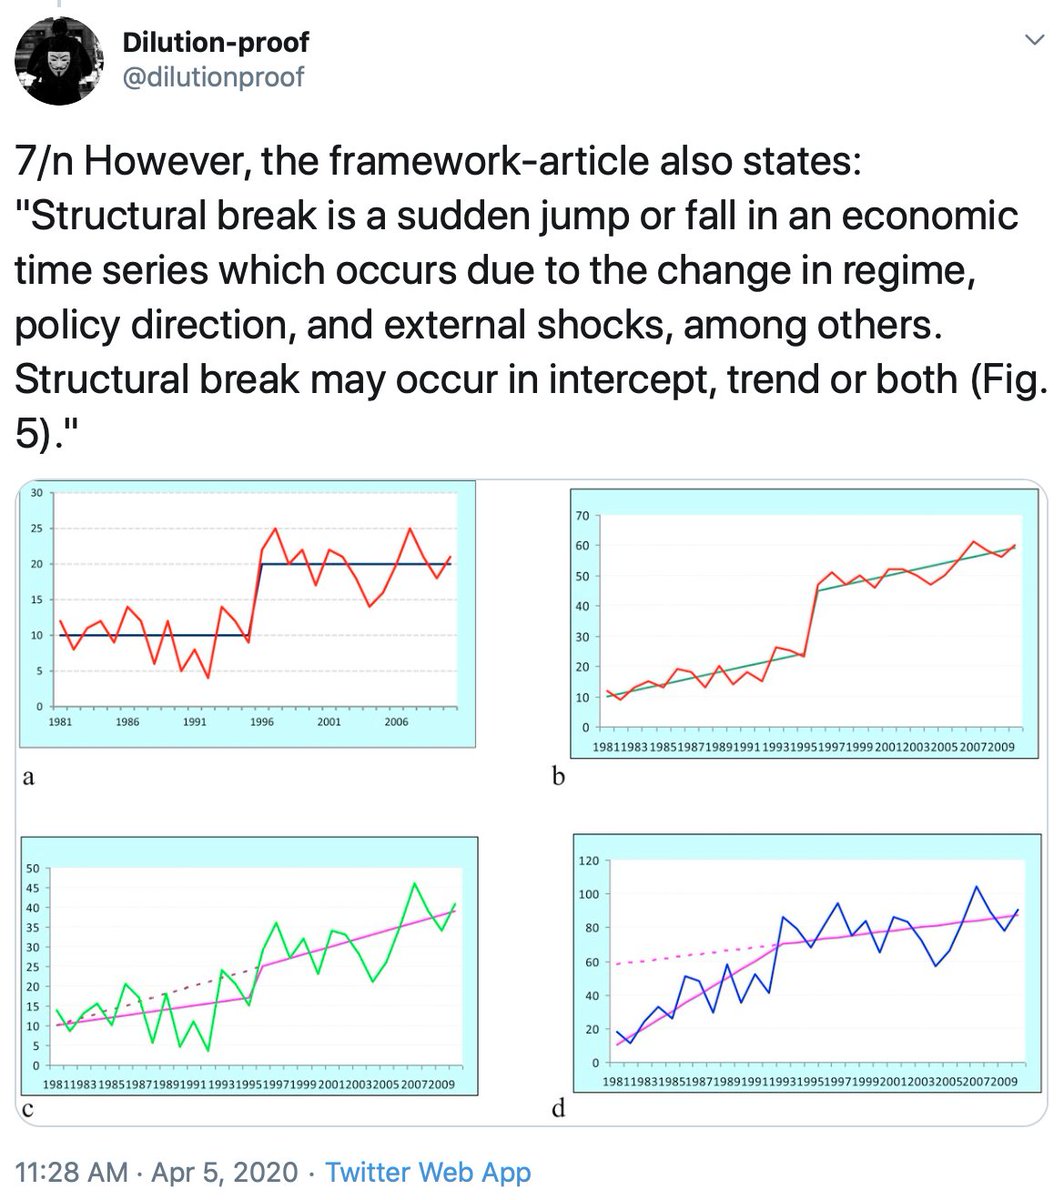
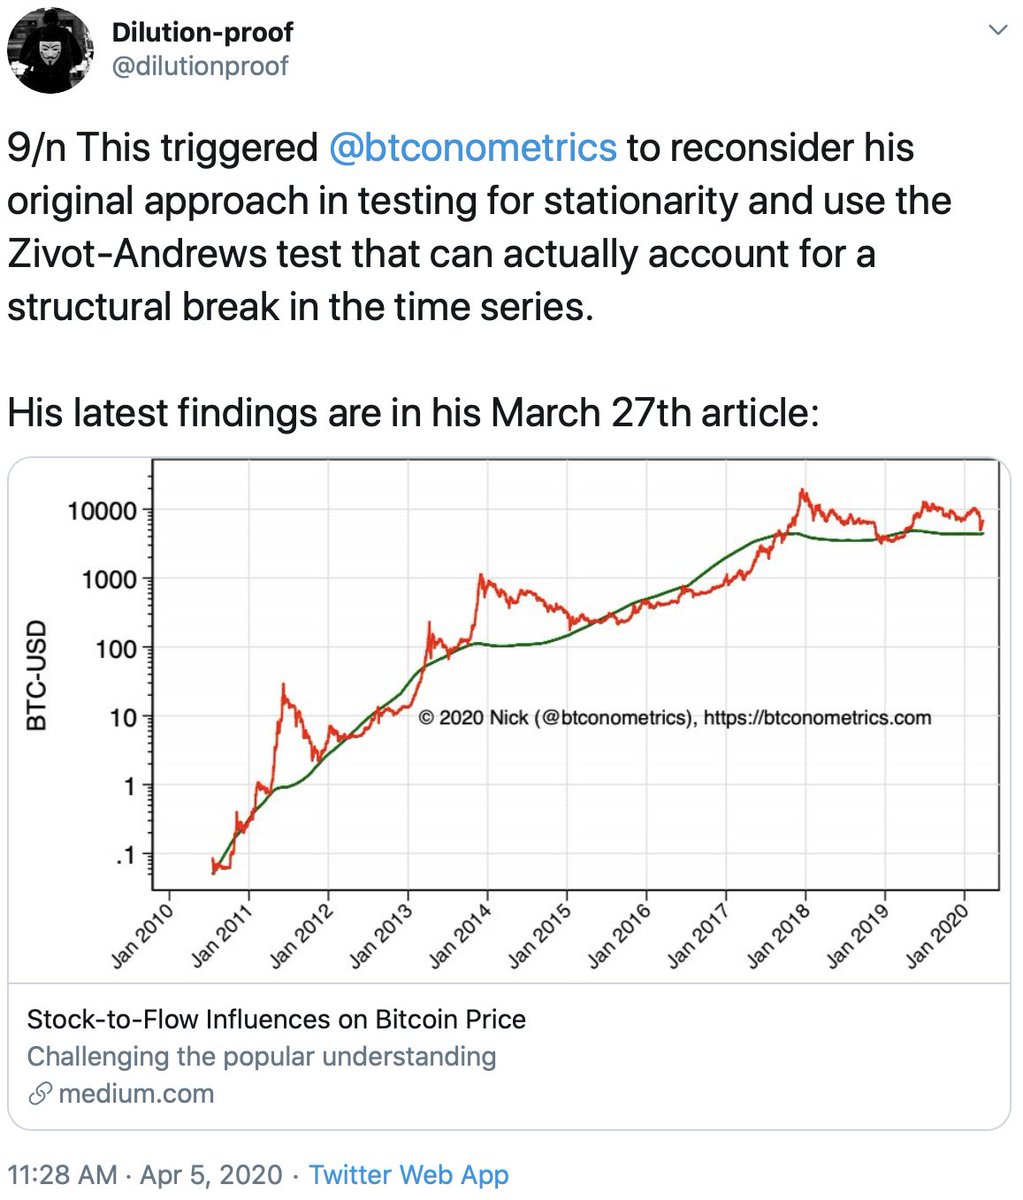
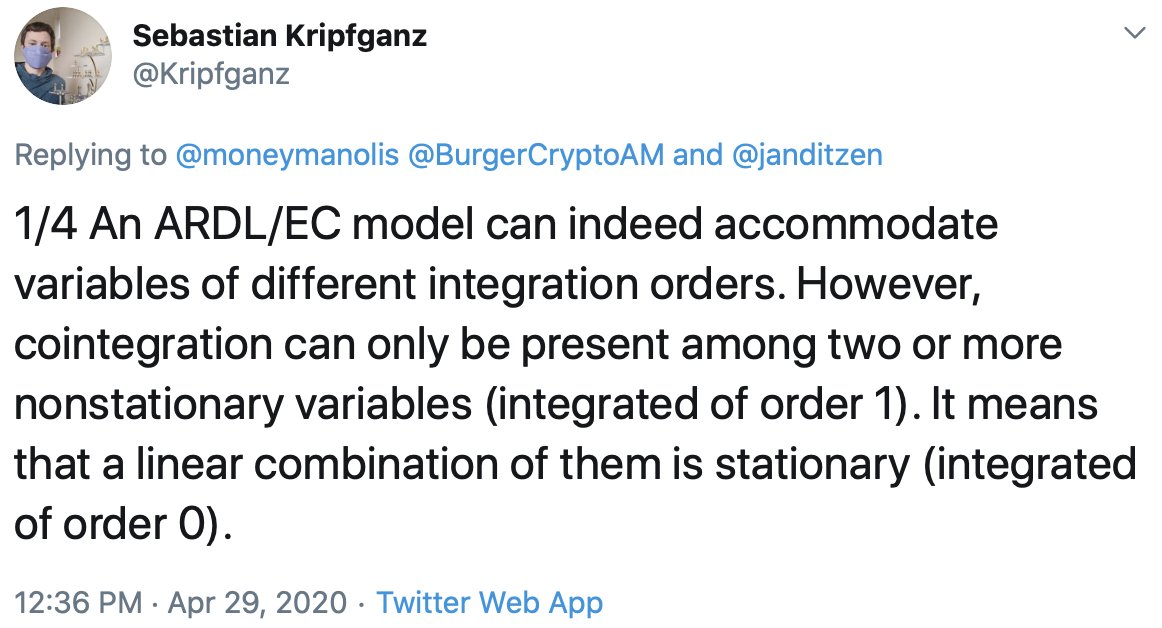
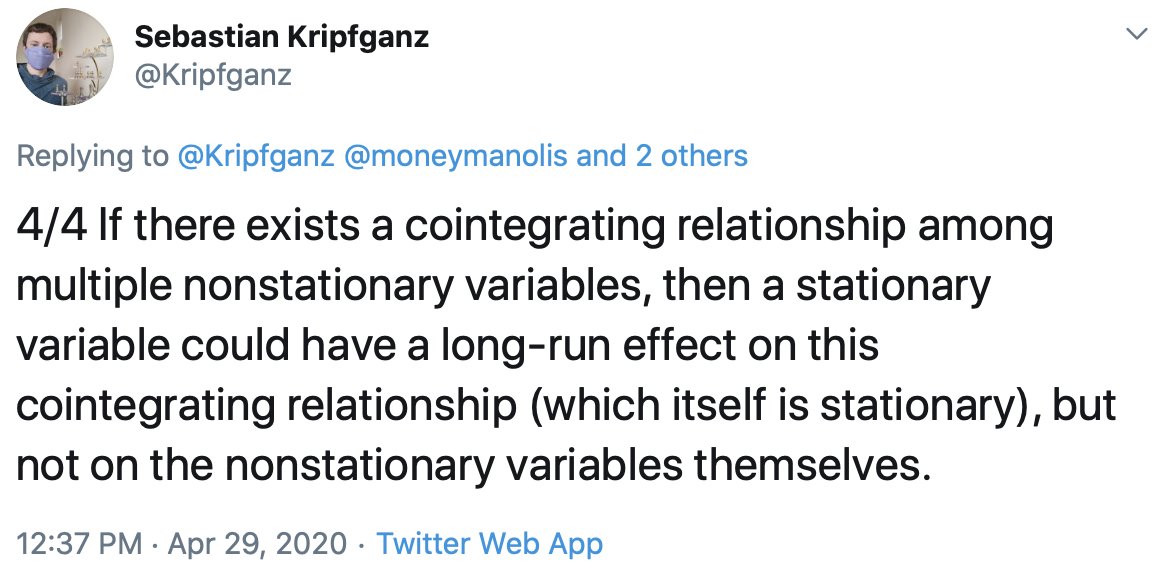
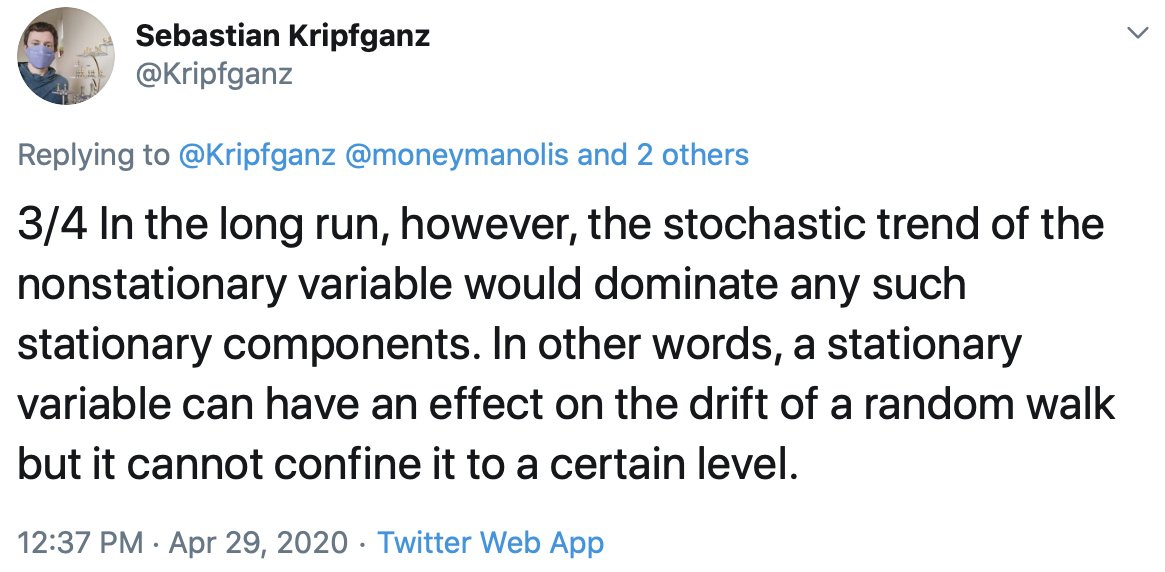
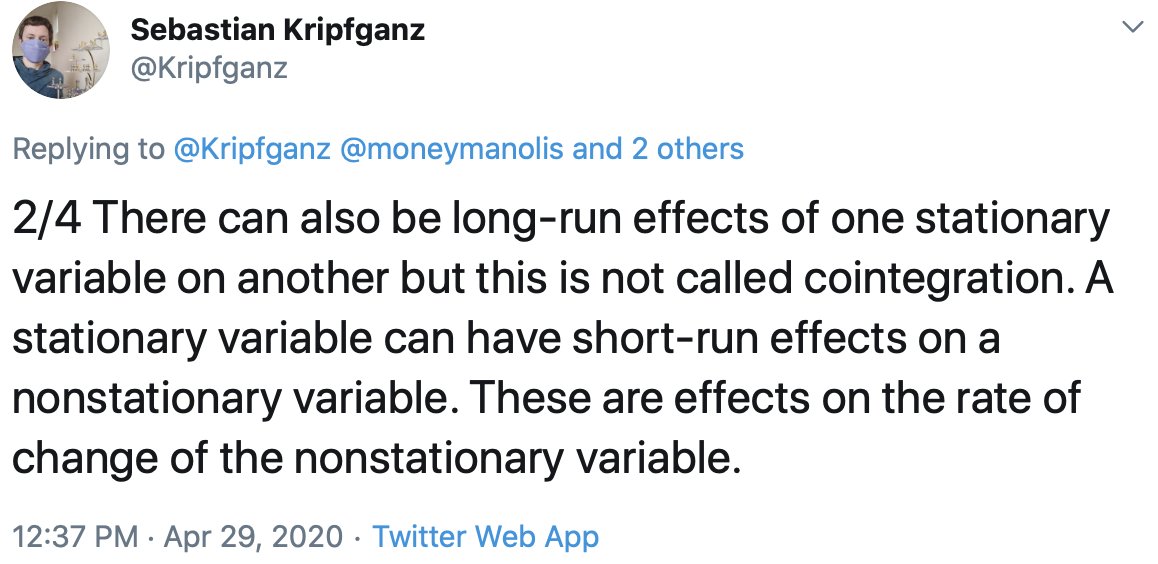
If it is stationary ("I(0)"): No cointegration.
If it is non-stationery ("I(1)"): Cointegration.
No pressure. No pressure at all.
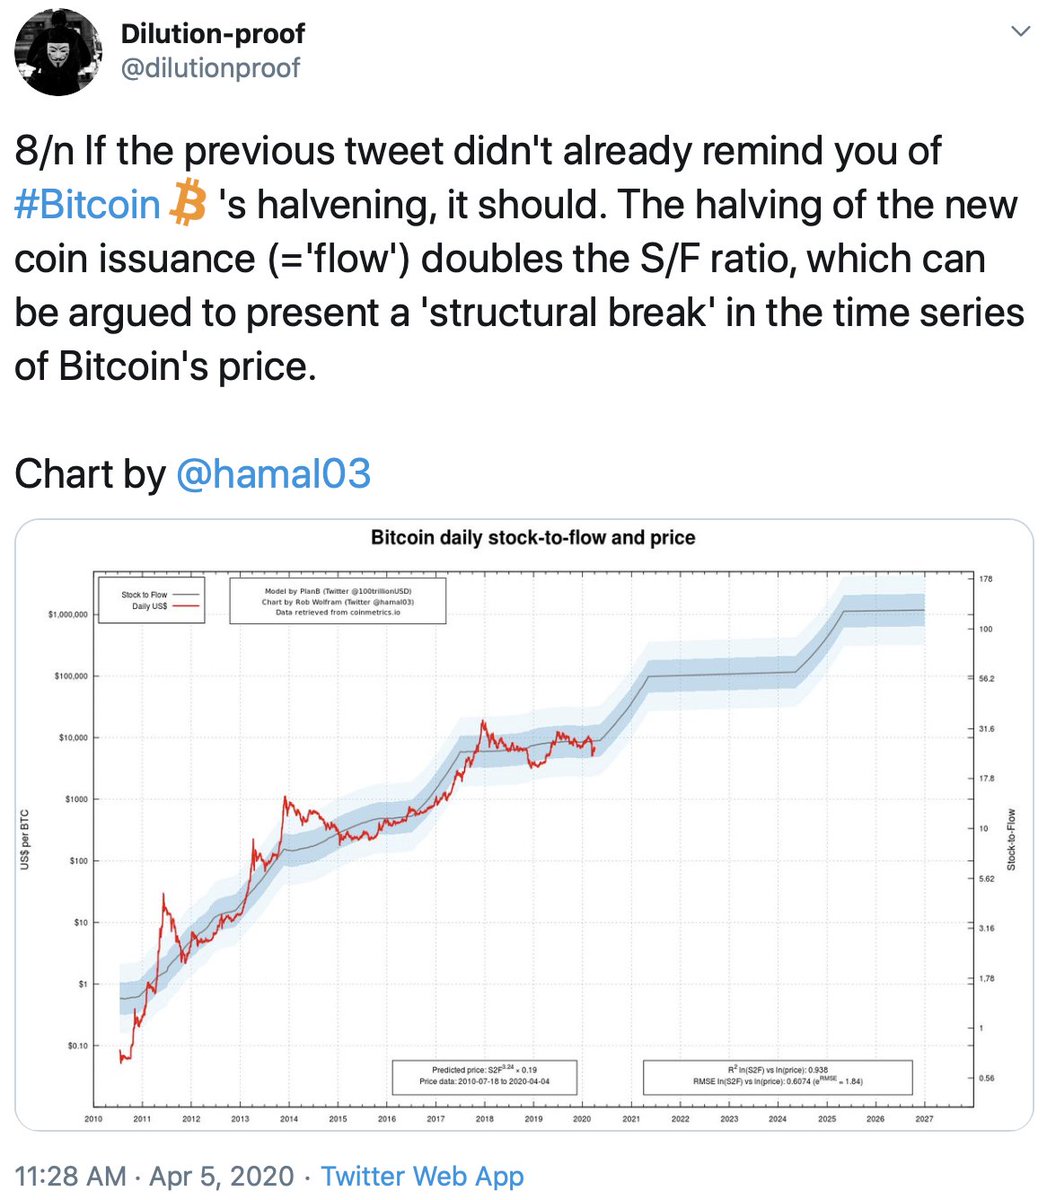
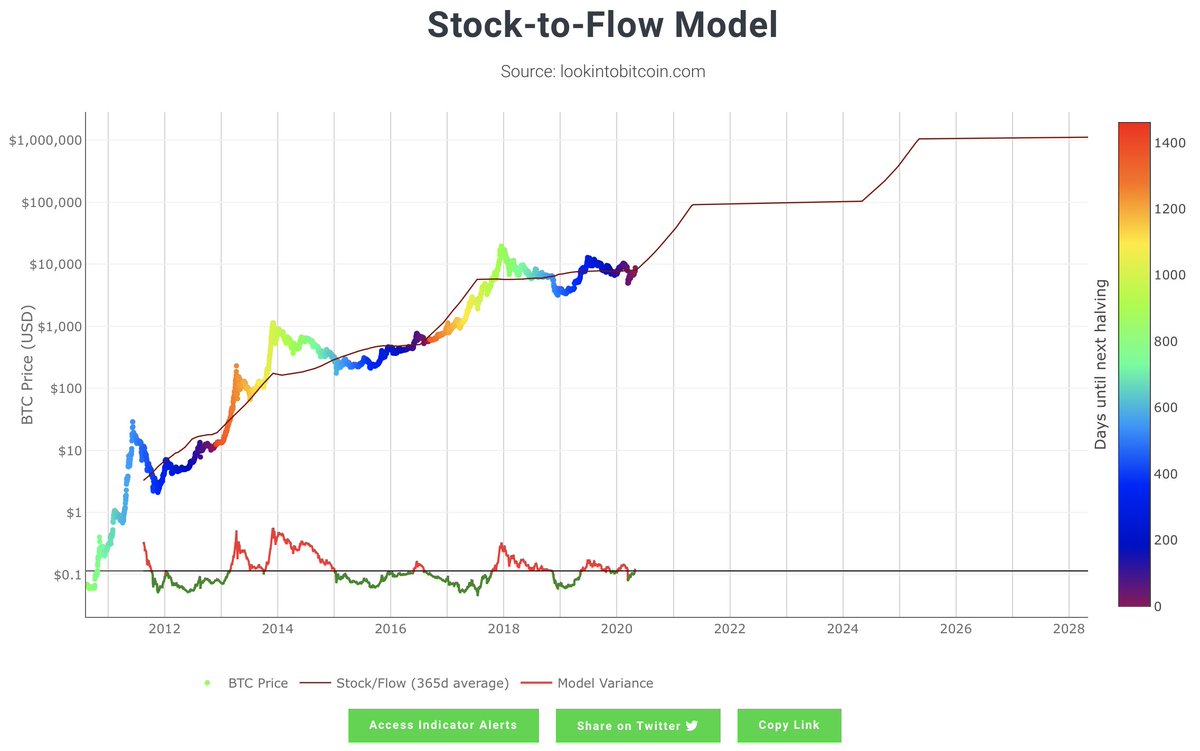
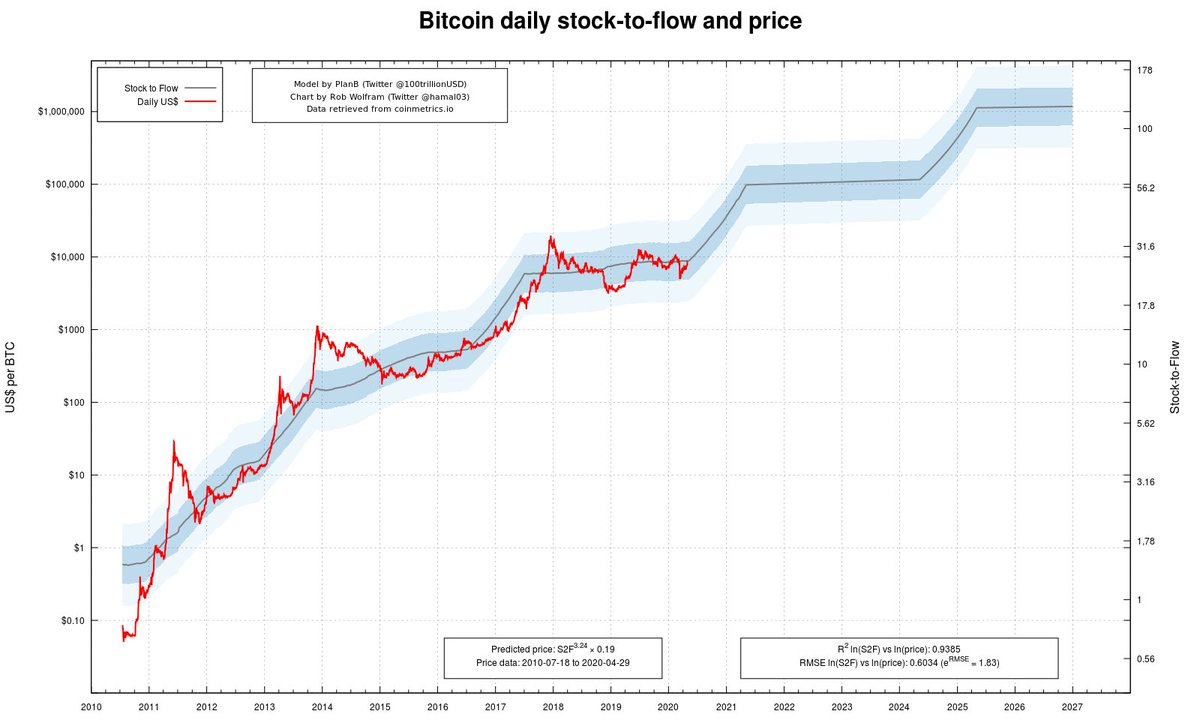
E.g., with daily data, the S2F ratio doubles within a single day, creating an abrupt jump in the model-price like we saw in the earlier versions of the S2F charts that @100trillionUSD shared.
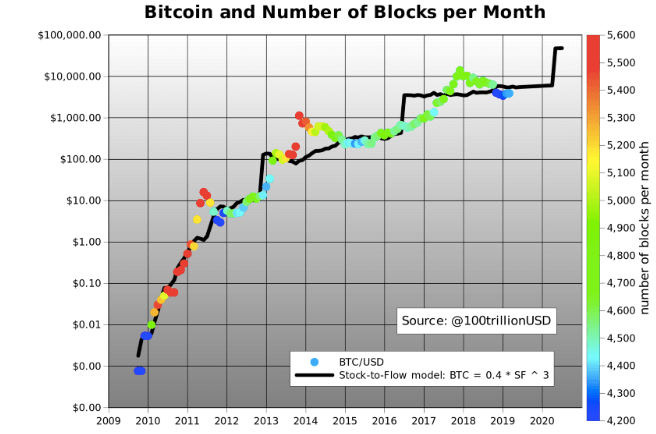
However; with a larger window (e.g. 1 year like is used for gold), S2F becomes more non-stationary.
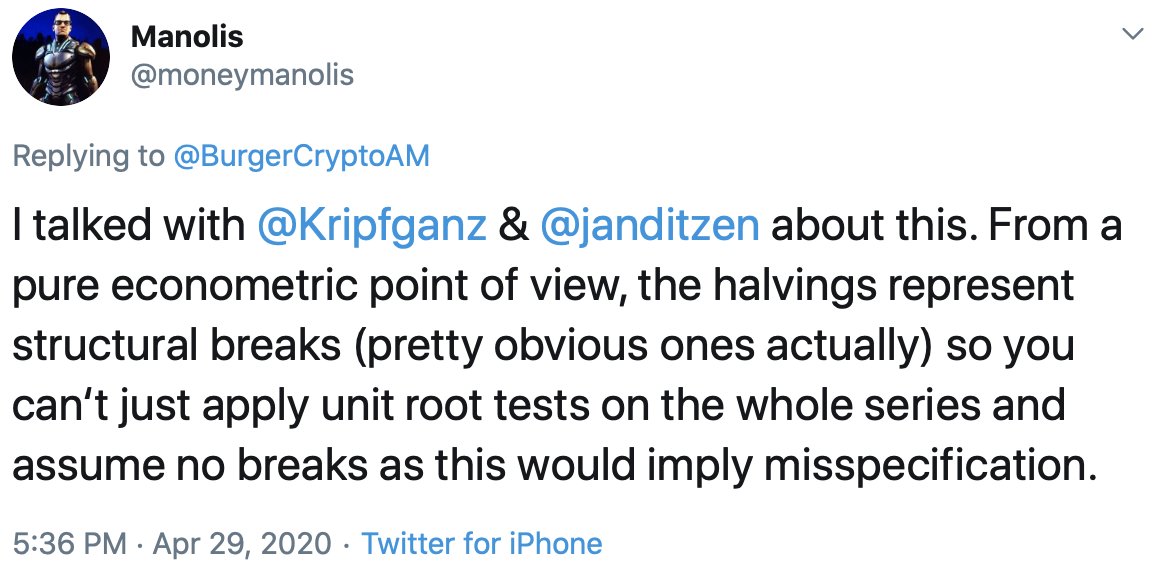
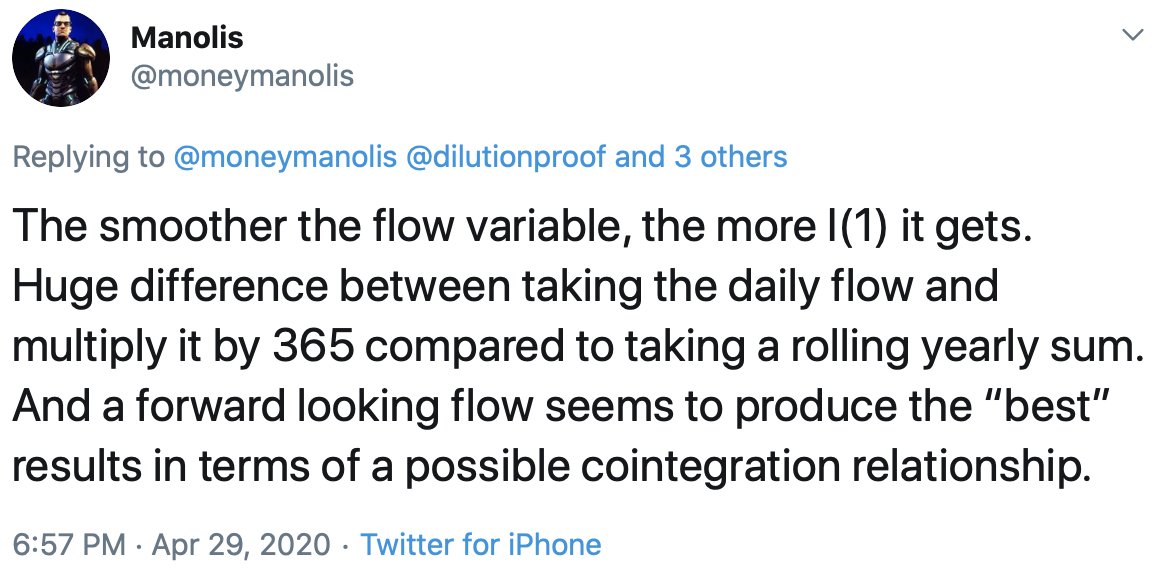
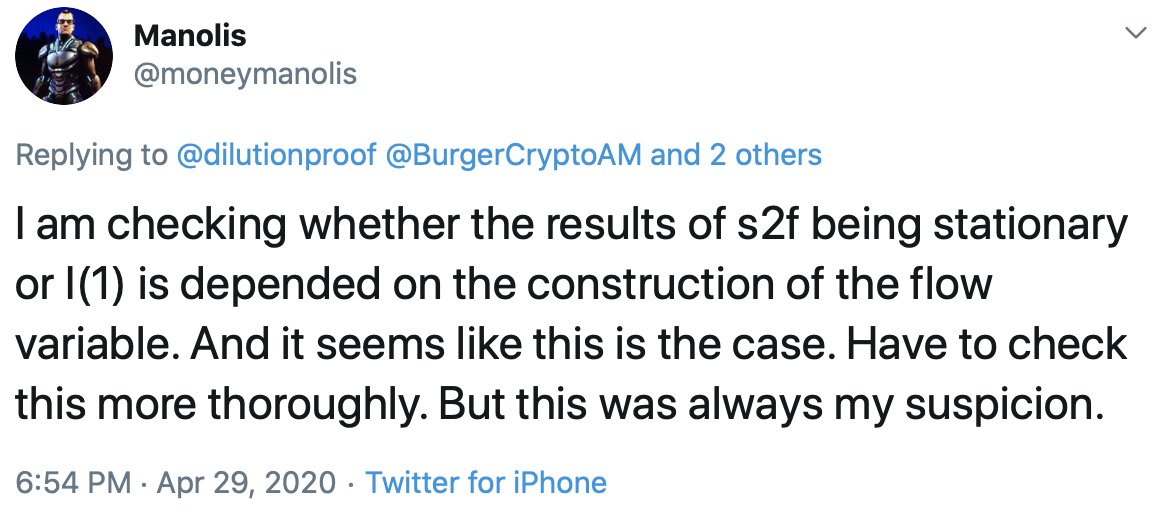
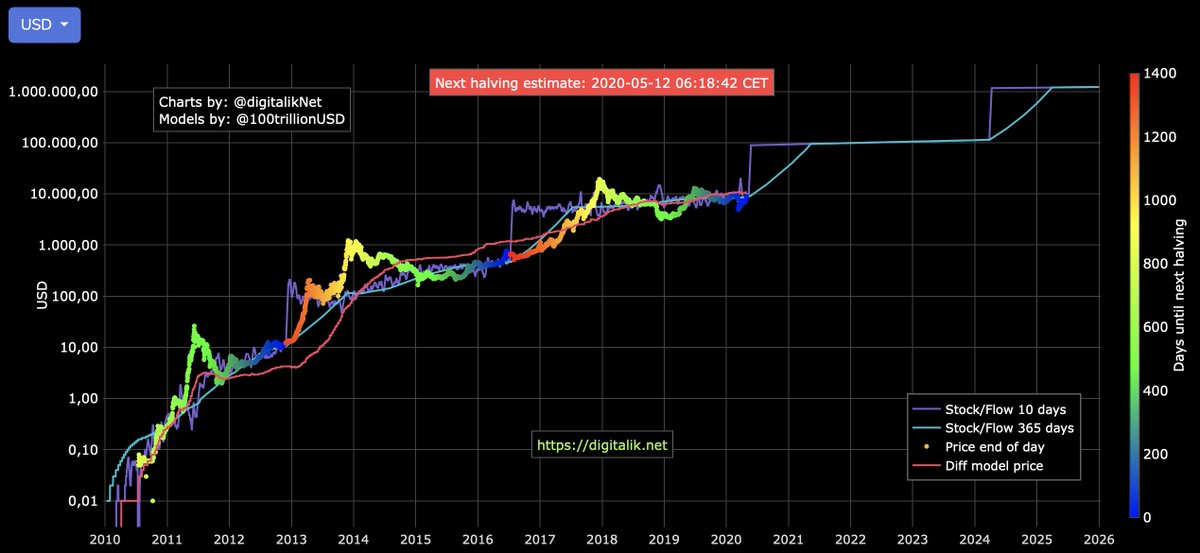
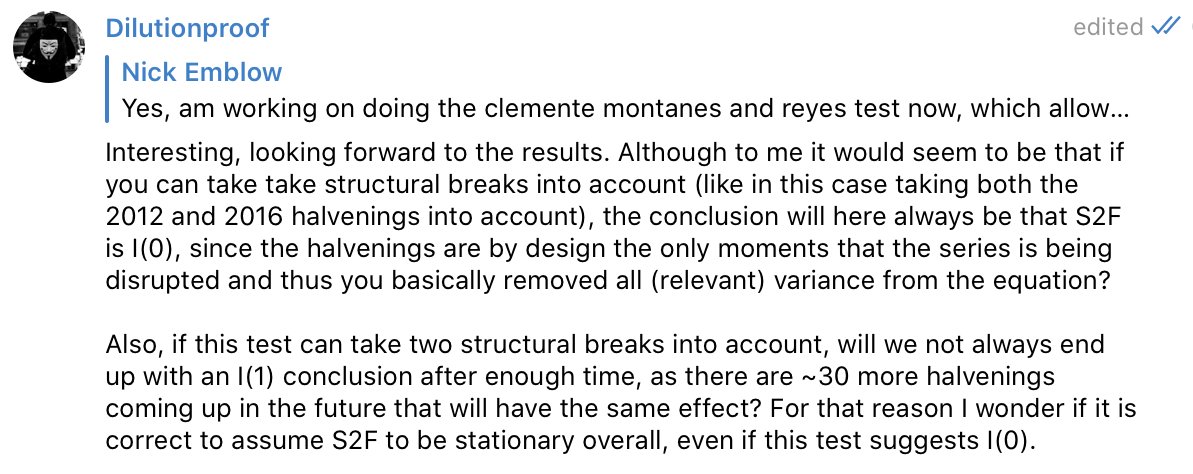
Using it in a graph is one thing, but using it in your data-analysis can be tricky, as @BurgerCryptoAM also points out:
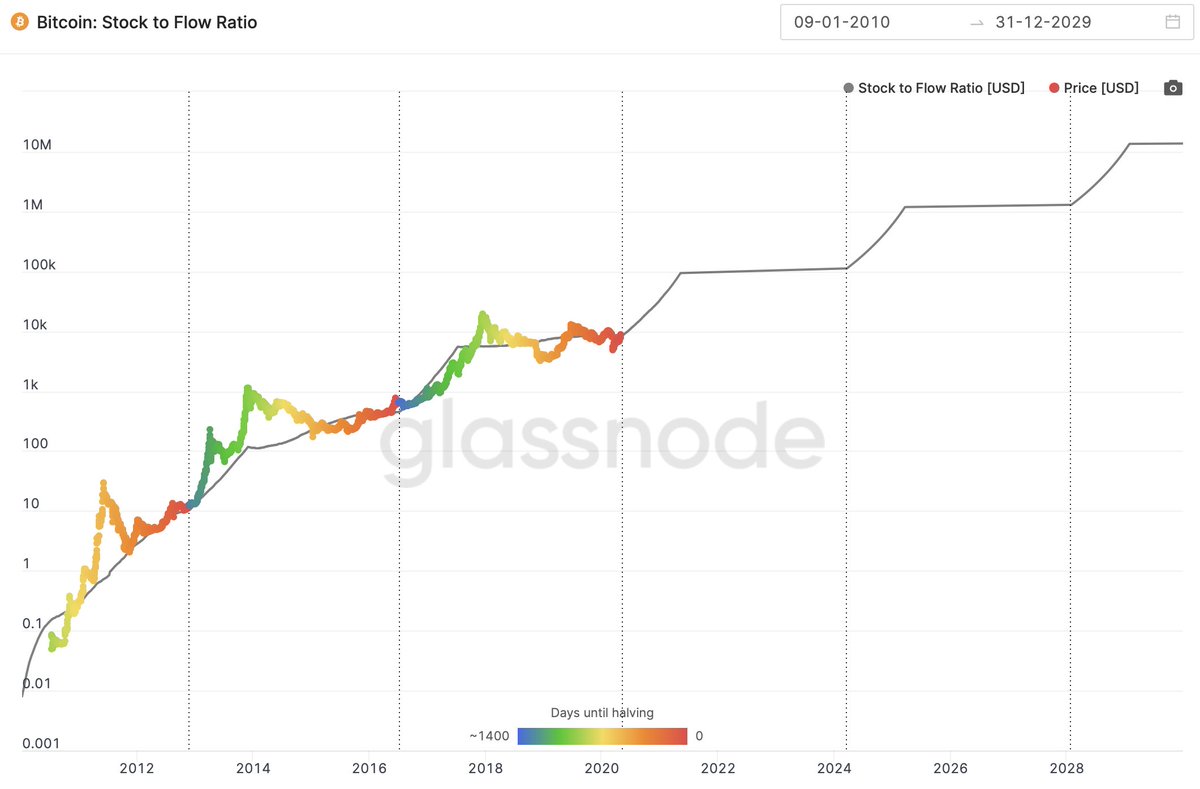
Looks like the fat lady hasn't sung yet. Grab a chair, grab some 🍿 and follow the guys mentioned in this thread to see where this goes next.


