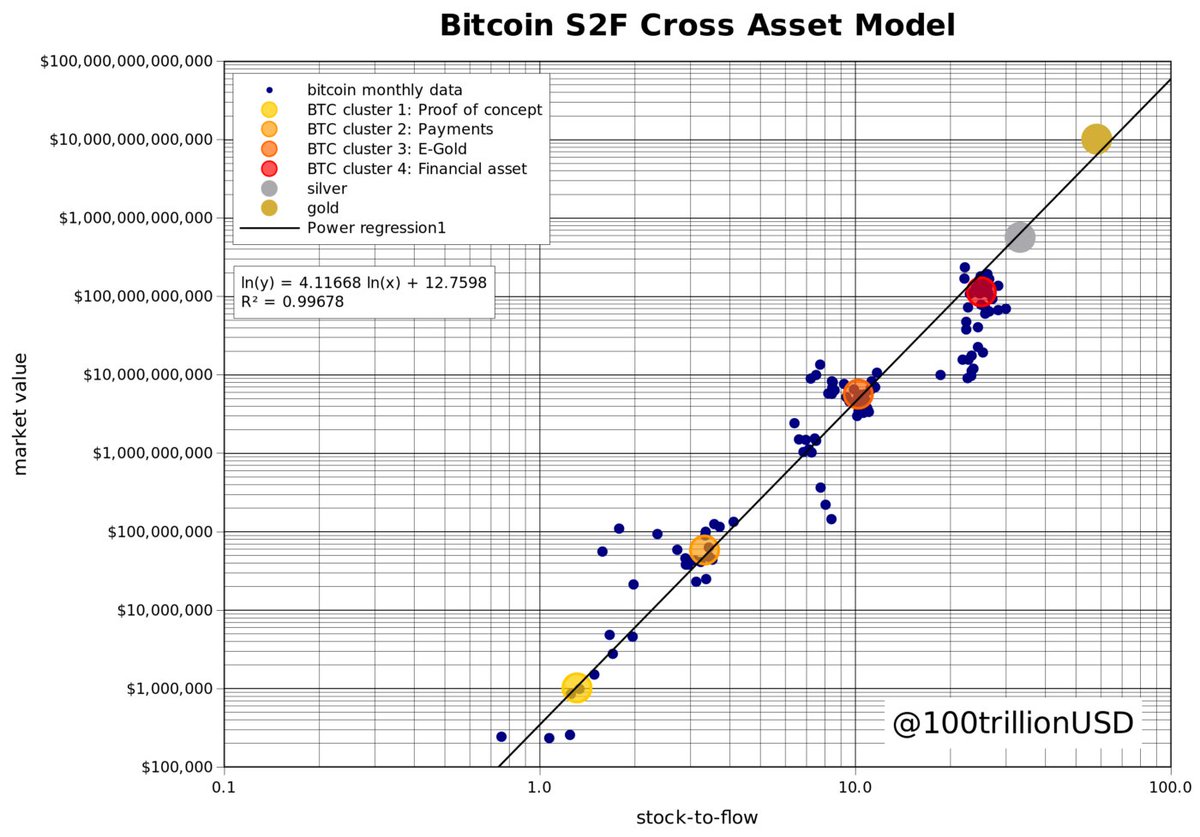
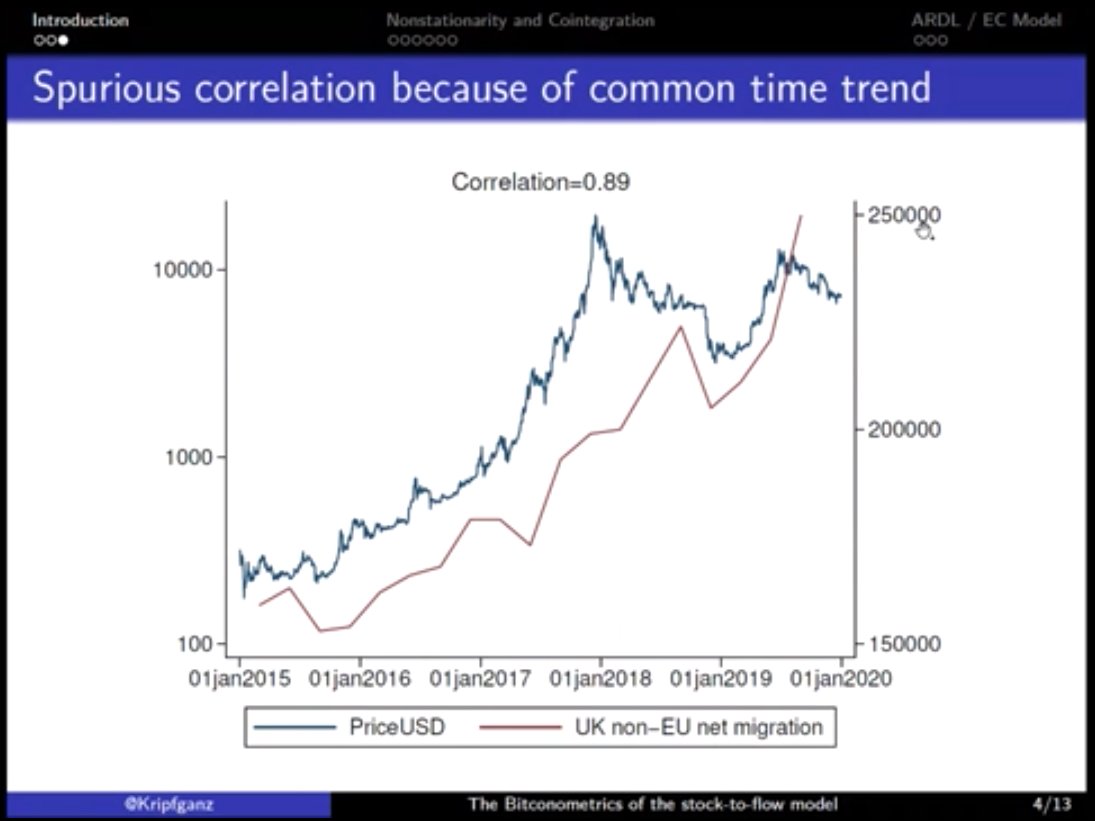
One of the first things he did was give an example of a spurious regression: Bitcoin is correlated (r=.89) with UK non-EU net migration! 😄
@Kripfganz showed examples of time series that are not stationary (random walks) & some that are.
The key question; which of these applies to Bitcoin?
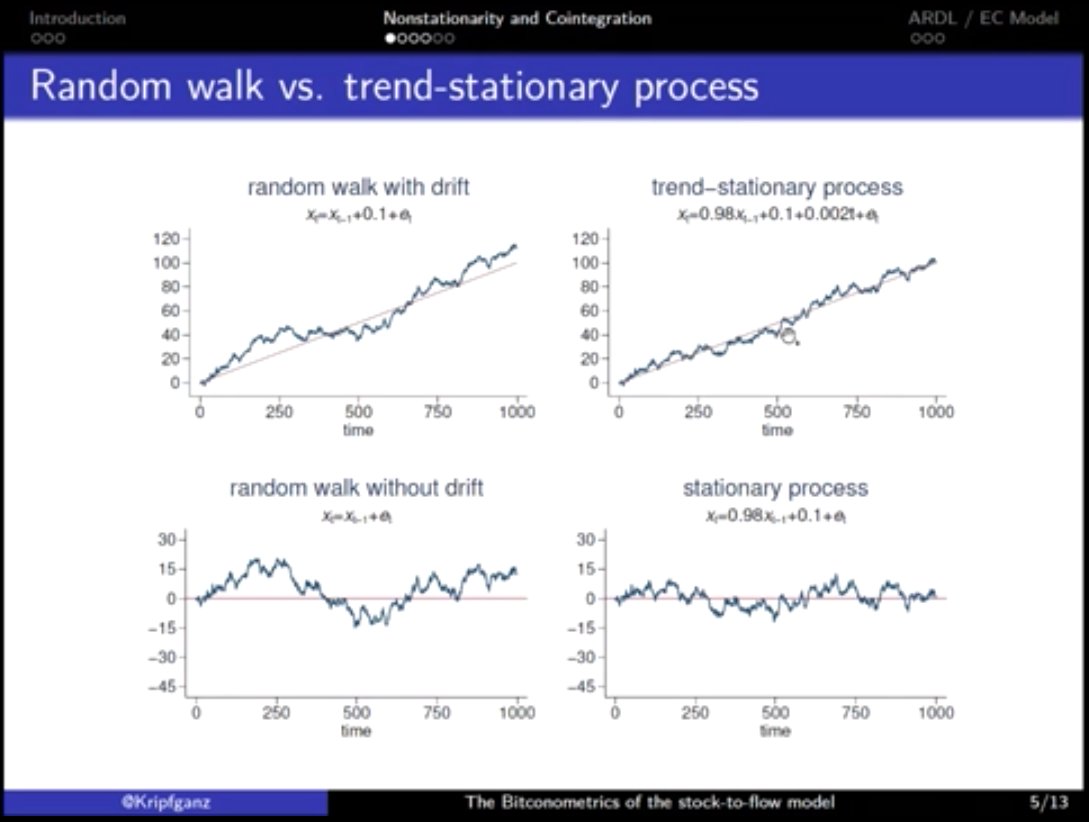
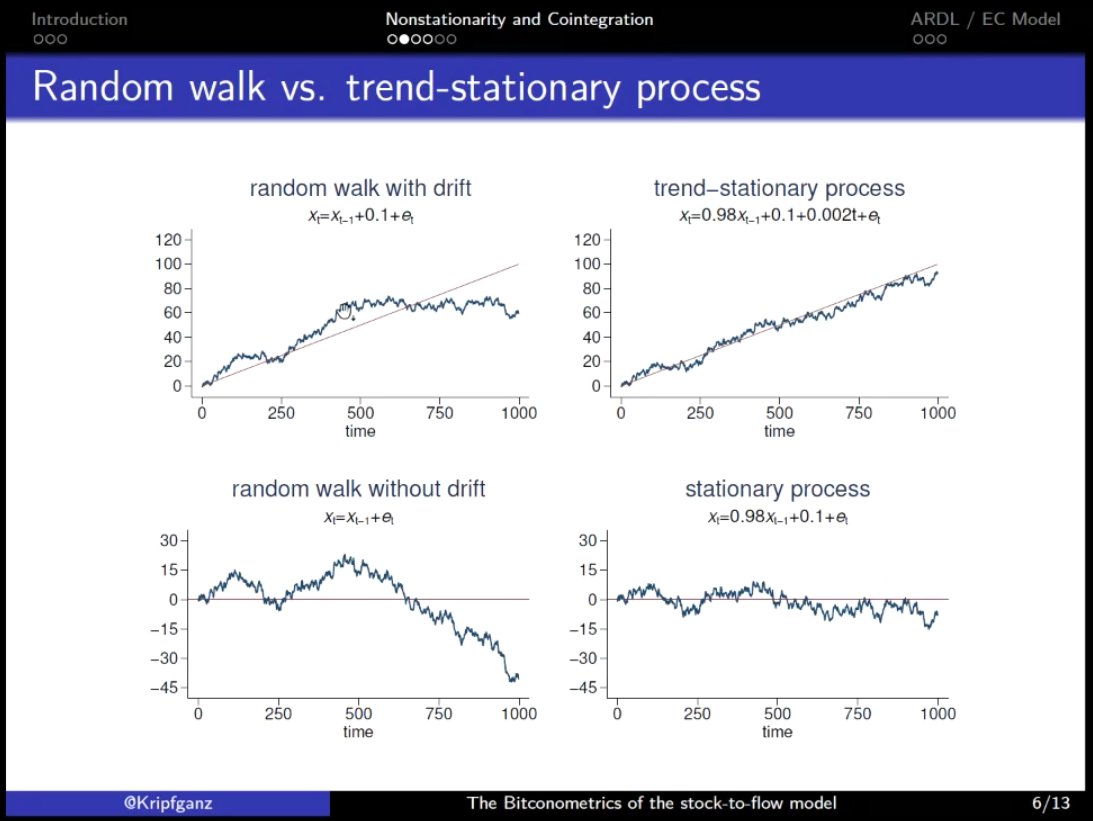
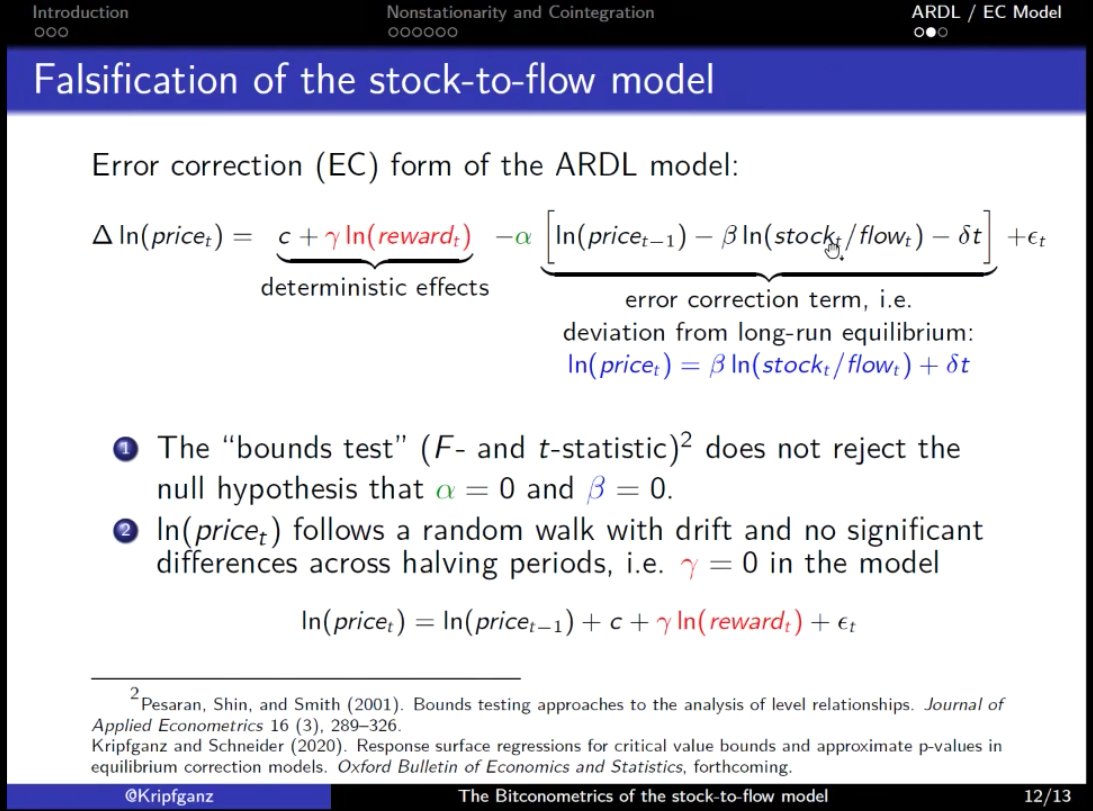
His conclusion: the (log) #Bitcoin price follows a random walk with drift (top left figures in the previous tweet) and has no significant differences across halving periods.
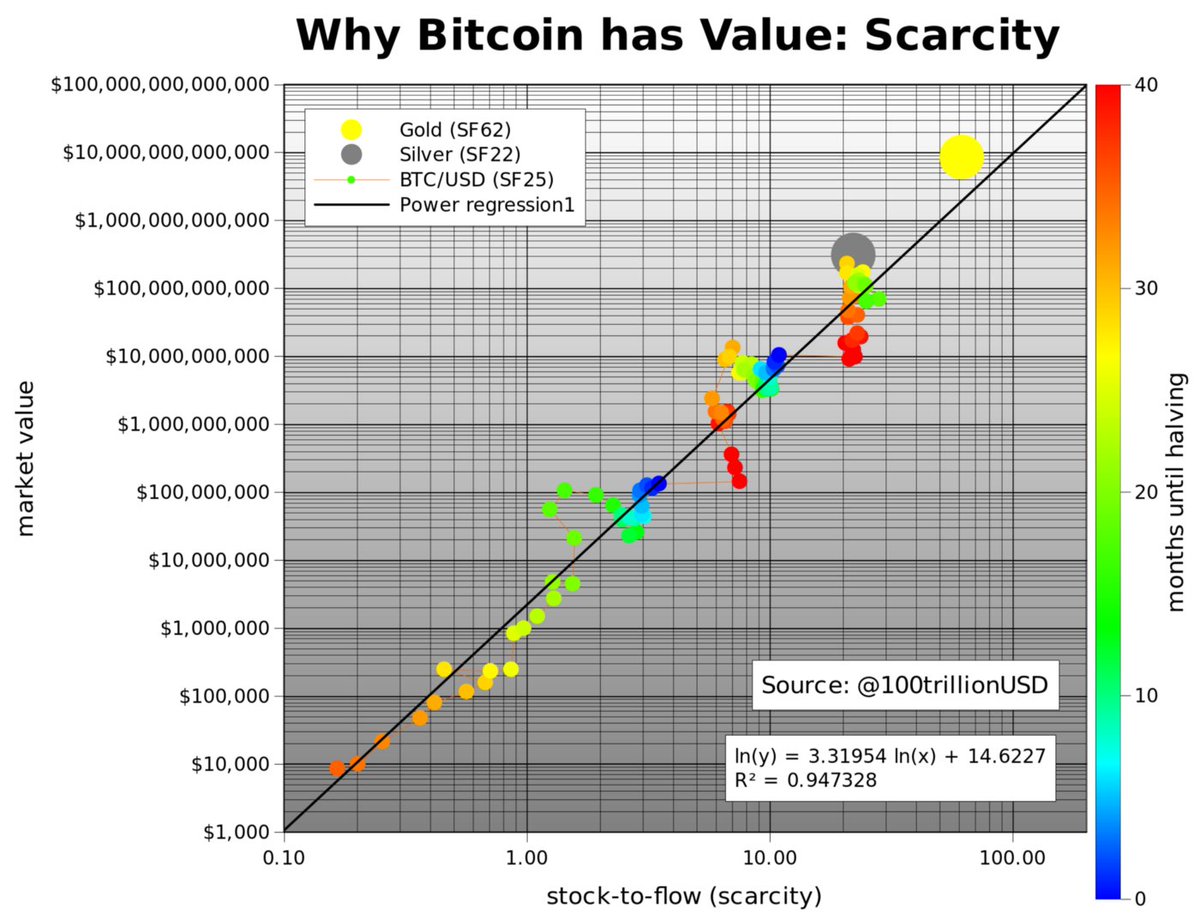
This graph puts the 🌈-chart by @ercwl & @rohmeo_de in a different light! 😅
I guess there's always a bigger fish.
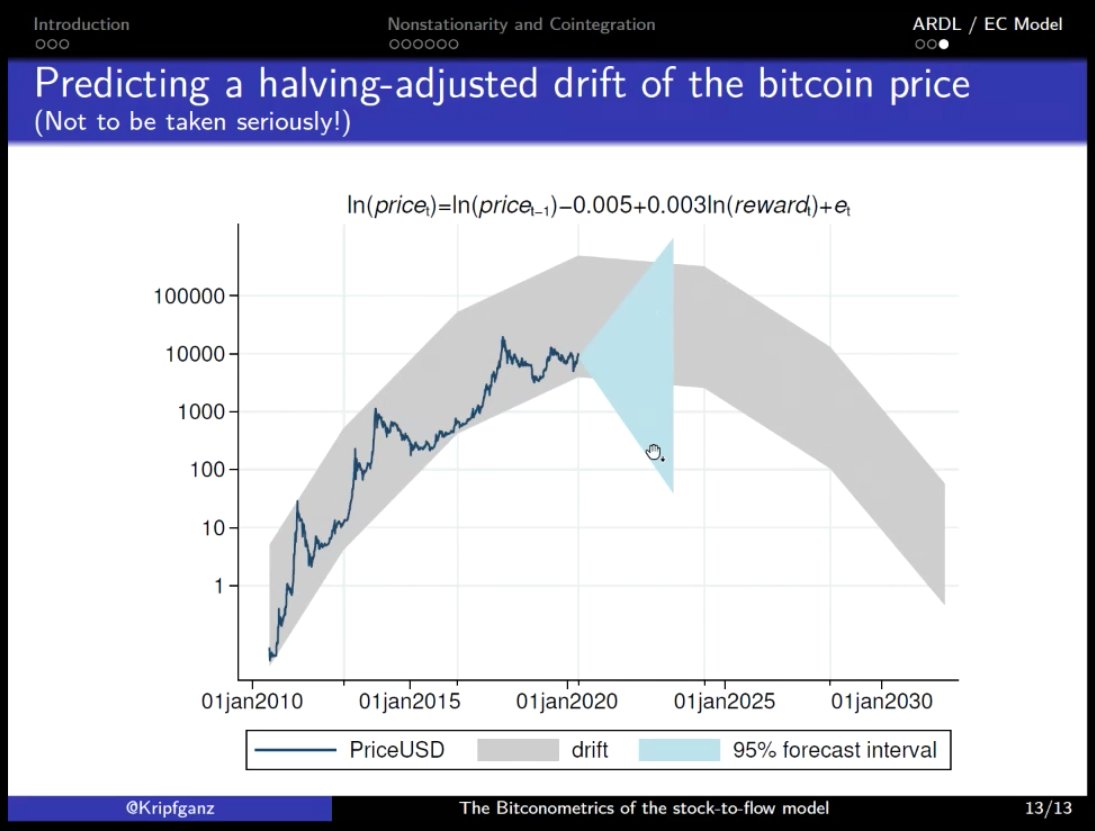
@Kripfganz's findings not only imply that there is no cointegration between #Bitcoin price & S2F ratio, but also that these time series should not be used to predict the future Bitcoin price, as it could go anywhere.
If all model's are thrown in the 🗑️, there's always praxeology to fall back on.
The @ValueOfBitcoin S2F-panelists seemed to agree that it is conceptually interesting, but 6 datapoints is too little. @ercwl also questioned the used gold & silver datapoints.
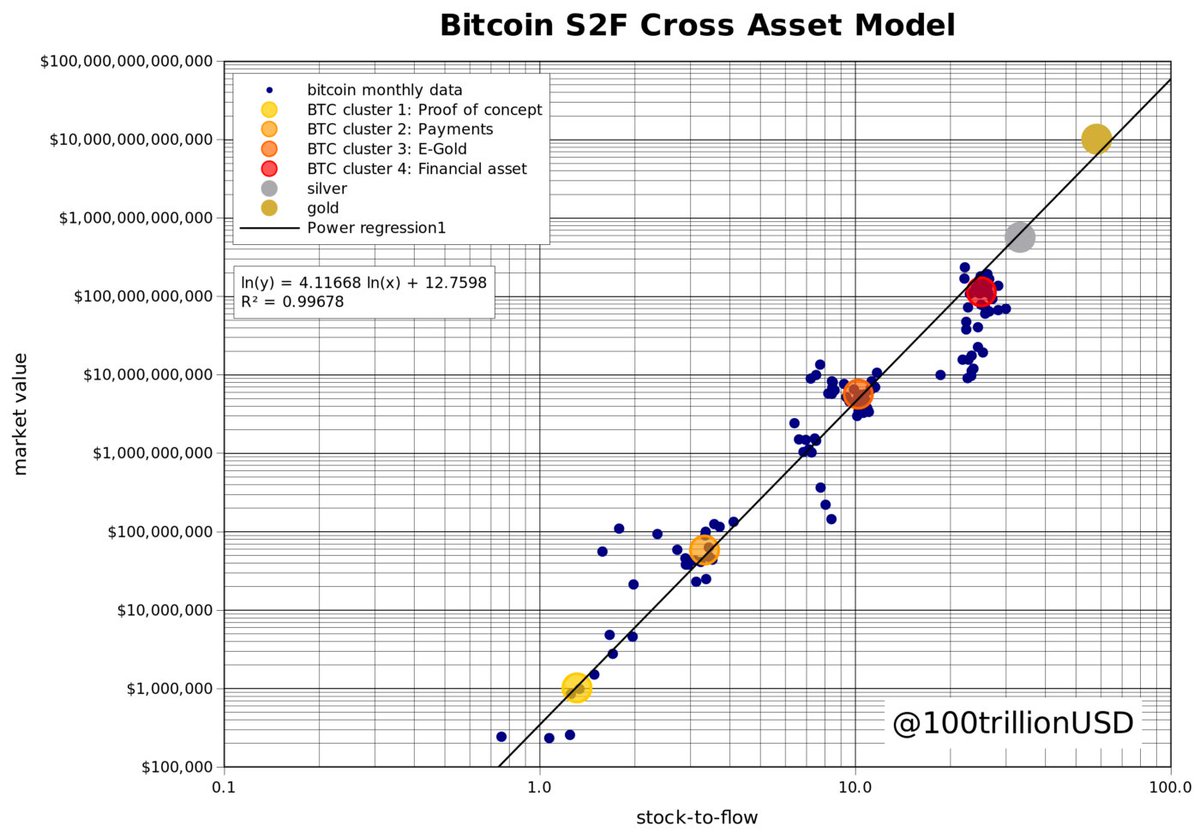
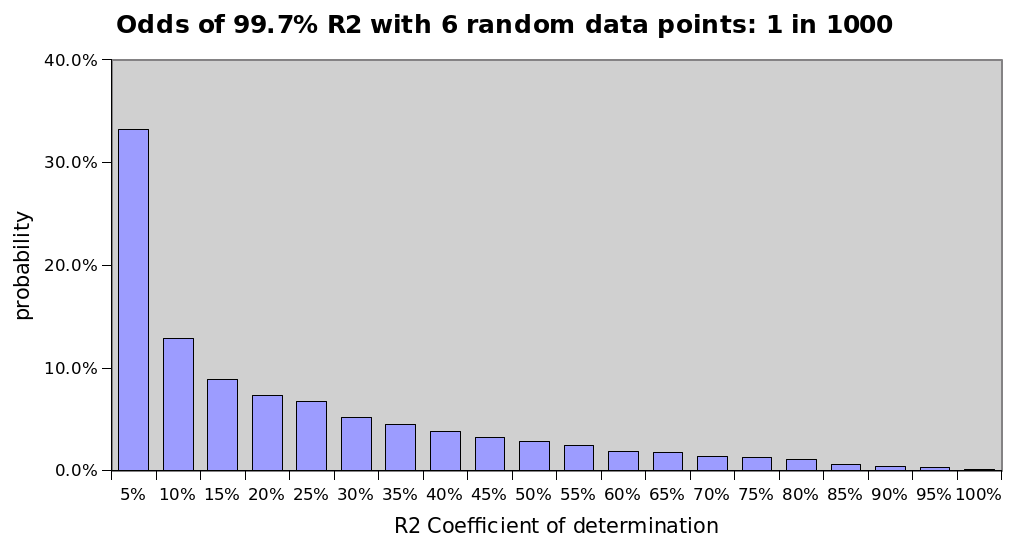
Could this be a case of 'where's smoke, there's fire'?
Or, as @btconometrics put it:


