Analysis: #NASDAQ $OSTK
Case 360 #Overstock.com Inc.
DISCLAIMER: The analysis is strictly for educational purposes and should not be construed as an invitation to trade.
#OSTK 1/4
Case 360 #Overstock.com Inc.
DISCLAIMER: The analysis is strictly for educational purposes and should not be construed as an invitation to trade.
#OSTK 1/4

Chart 1
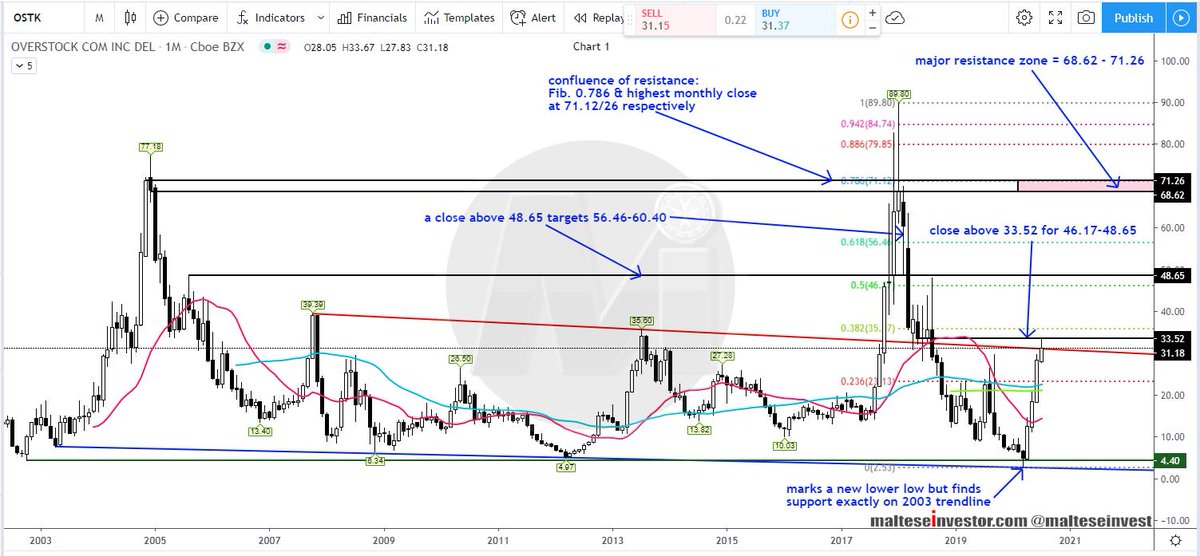
Monthly Chart: A new all time low was marked in Mar. 2020 but found #support on the 2003 trendline. #Momentum is positive and rising, price is attempting to close above the 2007 #trendline at 31.23 with #pivot resistance .....
OSTK 2/4
Monthly Chart: A new all time low was marked in Mar. 2020 but found #support on the 2003 trendline. #Momentum is positive and rising, price is attempting to close above the 2007 #trendline at 31.23 with #pivot resistance .....
OSTK 2/4
..... at 33.52 - a close above targets 46.17-48.65. Further up the major #resistance zone of 68.72 - 71.26 - expecting failure to break above, but #Fib. 0.618 at 56.46 should then contain the downside.
OSTK 3/4
OSTK 3/4