Chart 1
Weekly Chart: The #SMA 50 has acted as support since Oct. 2019, this was followed up by a momentum build and a subsequent break above the 2018 #pivot range, then the #parabolic move, closing/holding well .....
BILI 2/4
Weekly Chart: The #SMA 50 has acted as support since Oct. 2019, this was followed up by a momentum build and a subsequent break above the 2018 #pivot range, then the #parabolic move, closing/holding well .....
BILI 2/4
..... above 2018 #trendline resistance. Price is now targeting synthetic resistances sloping at 52.03, 59.24 and 66.52.
BILI 3/4
BILI 3/4
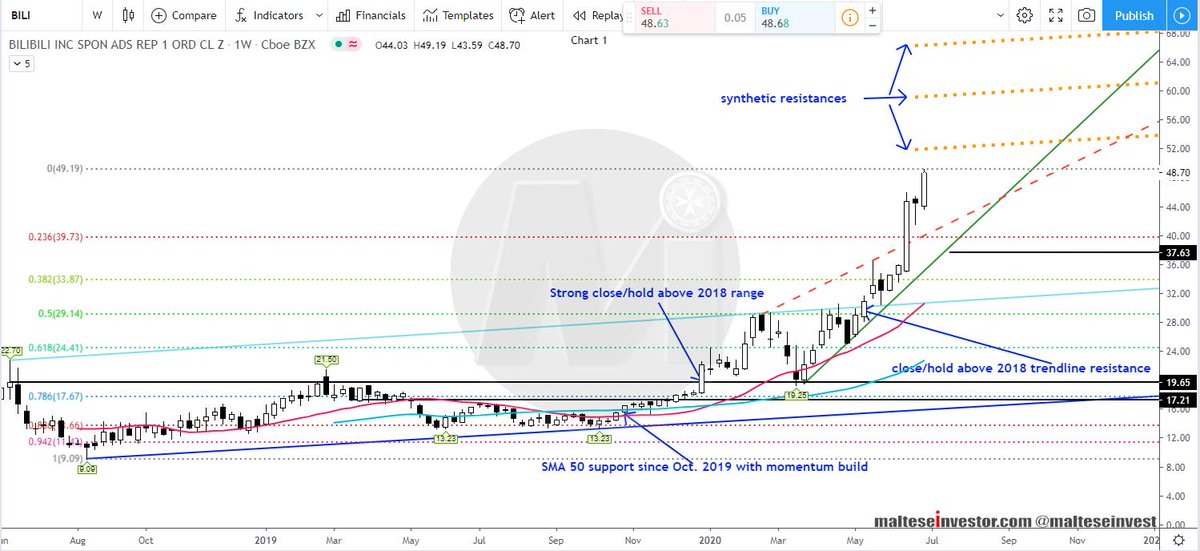
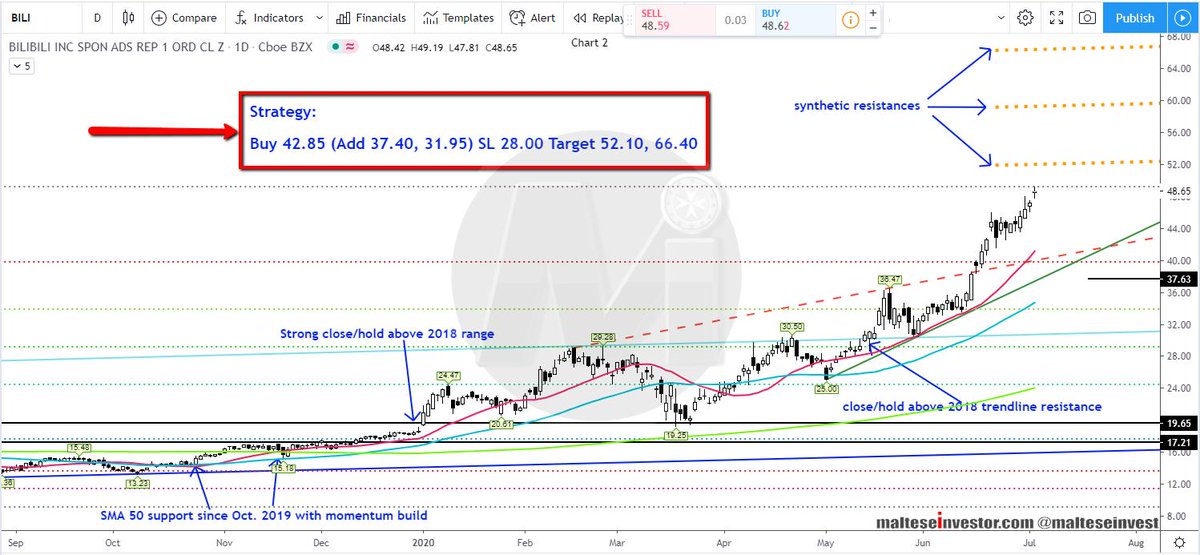
Chart 2
Daily Chart: The parabolic move poses a risk, the best #support is seen at 40.46 (Feb. 2020 trendline #resistance turned support) then ideally 37.63 (rising trendline) then #Fib 0.382 and #cluster support circa 33.95.
The #Strategy is printed on the image.
$BILI 4/4
Daily Chart: The parabolic move poses a risk, the best #support is seen at 40.46 (Feb. 2020 trendline #resistance turned support) then ideally 37.63 (rising trendline) then #Fib 0.382 and #cluster support circa 33.95.
The #Strategy is printed on the image.
$BILI 4/4