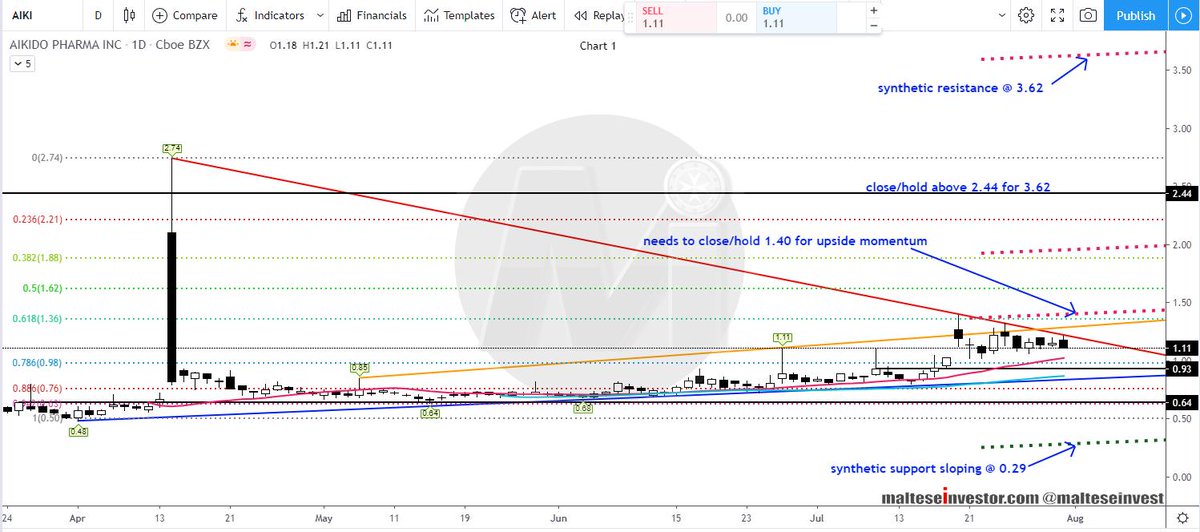
Daily Chart: Price needs to break above Apr. 2020 #trendline resistance then close/hold above 1.40 for upside #momentum. A close above 2.44 is required to target synthetic #resistance at 3.62, then 5.21. To .....
AIKI 2/5
AIKI 3/5
4 Hour Chart: Price has closed below the #SMA 50 and appears to be targeting the #confluence of support of the SMA 20 and #Fib. 0.786 at 0.98. Further down Apr. 2020 trendline support at 0.84. A close/hold below 0.48 could target synthetic .....
AIKI 4/5

