My Authors
Read all threads
Analysis: #NASDAQ $LOGI

Case 409 #Logitech International S.A.

DISCLAIMER: The analysis is strictly for educational purposes and should not be construed as an invitation to trade.

#LOGI 1/4
Chart 1
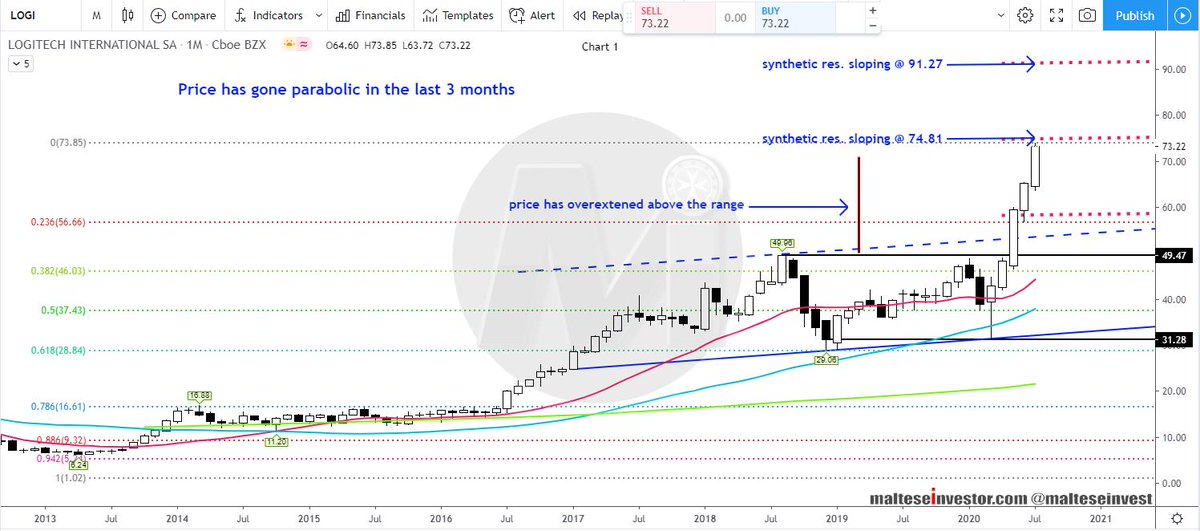
Monthly Chart: Price has gone #parabolic smashing through the 2018 #pivot and sloping #trendline resistance at 49.96-53.20 respectively and overextended way beyond the 2 year range. Synthetic #resistance at 74.81 - a close above .....

LOGI 2/4
..... targets 91.27. Immediate #support is seen between 67.66/04, then 58.42 and 53.88 (2018 trendline turned support).

LOGI 3/4
Chart 2
Daily Chart: Immediate resistance above 74.81 lies at 76.64. The #SMA 20 (69.00) is riding the May 2020 trendline - it's too risky to buy here - we position ourselves, on the first order, slightly below.

The #Strategy is printed on the image.

$LOGI 4/4
Missing some Tweet in this thread? You can try to force a refresh.

Keep Current with malteseinvestor

Profile picture

Stay in touch and get notified when new unrolls are available from this author!

Read all threads

This Thread may be Removed Anytime!

Twitter may remove this content at anytime, convert it as a PDF, save and print for later use!

Try unrolling a thread yourself!

how to unroll video

1) Follow Thread Reader App on Twitter so you can easily mention us!

2) Go to a Twitter thread (series of Tweets by the same owner) and mention us with a keyword "unroll" @threadreaderapp unroll

You can practice here first or read more on our help page!

Follow Us on Twitter!

Did Thread Reader help you today?

Support us! We are indie developers!


This site is made by just two indie developers on a laptop doing marketing, support and development! Read more about the story.

Become a Premium Member ($3.00/month or $30.00/year) and get exclusive features!

Become Premium

Too expensive? Make a small donation by buying us coffee ($5) or help with server cost ($10)

Donate via Paypal Become our Patreon

Thank you for your support!