The presenter puts up a slide showing “random forest variable importance.” You know the one...
The sideways bar plot.
Says “only showing the top 20 variables here...” to highlight the hi-dimensional power of random forests.
The slide is awkwardly wide-screen. Everyone squints.
The sideways bar plot.
Says “only showing the top 20 variables here...” to highlight the hi-dimensional power of random forests.
The slide is awkwardly wide-screen. Everyone squints.
A clinician in the front row exclaims, “Wow, that makes so much sense!”
Silence.
Then someone asks, “What do the length of the bars mean?”
The presenter starts to answer when someone else butts in, “Does the fact that they are pointing the same direction mean anything?”
Silence.
Then someone asks, “What do the length of the bars mean?”
The presenter starts to answer when someone else butts in, “Does the fact that they are pointing the same direction mean anything?”
The audience stares at the presenter expectantly. There will be a deep explanation.
“The bar length is relative... the amplitude doesn’t have any interpretable meaning. But look at the top 3 variables. Ain’t that something?”
The clinicians exhale and whisper in reverence.
“The bar length is relative... the amplitude doesn’t have any interpretable meaning. But look at the top 3 variables. Ain’t that something?”
The clinicians exhale and whisper in reverence.
Ask yourself:
- What *do* the bars mean?
- Does ordering of the bars actually matter?
- Is “random forest variable importance” one thing, or many?
- Does the way you construct the trees matter?
Like/RT and I’ll return to this in a bit w/ a nice paper looking at all of these.
- What *do* the bars mean?
- Does ordering of the bars actually matter?
- Is “random forest variable importance” one thing, or many?
- Does the way you construct the trees matter?
Like/RT and I’ll return to this in a bit w/ a nice paper looking at all of these.
Before we answer the question of what random forest variable importance means, let’s take a look at a random forest variable importance plot created on simulated data. Which is the most important variable? 
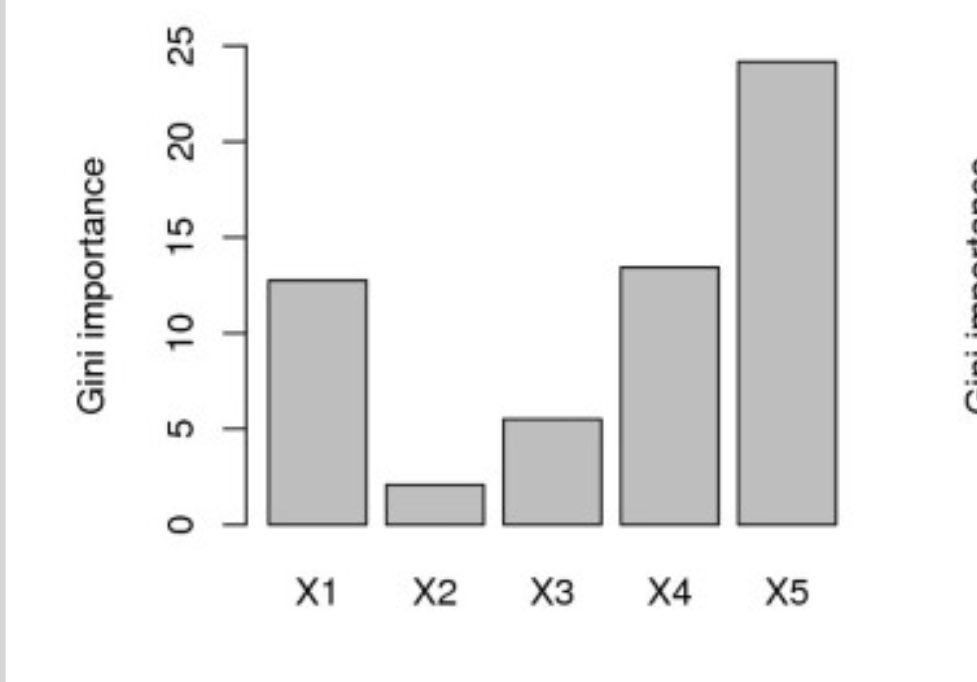
So which is it?
WRONG!!!
Now what if I told you that these were the variable importance scores assigned by a random forest where the 5 predictors were *simply RANDOM numbers*?
Great, now I have your attention.
Now what if I told you that these were the variable importance scores assigned by a random forest where the 5 predictors were *simply RANDOM numbers*?
Great, now I have your attention.
Fine, you’re thinking to yourself: that was cheating. What about a situation where only a single variable is correlated with the outcome in simulated data and the other variables are just noise?
Can you find the 1 important variable?
Can you find the 1 important variable?
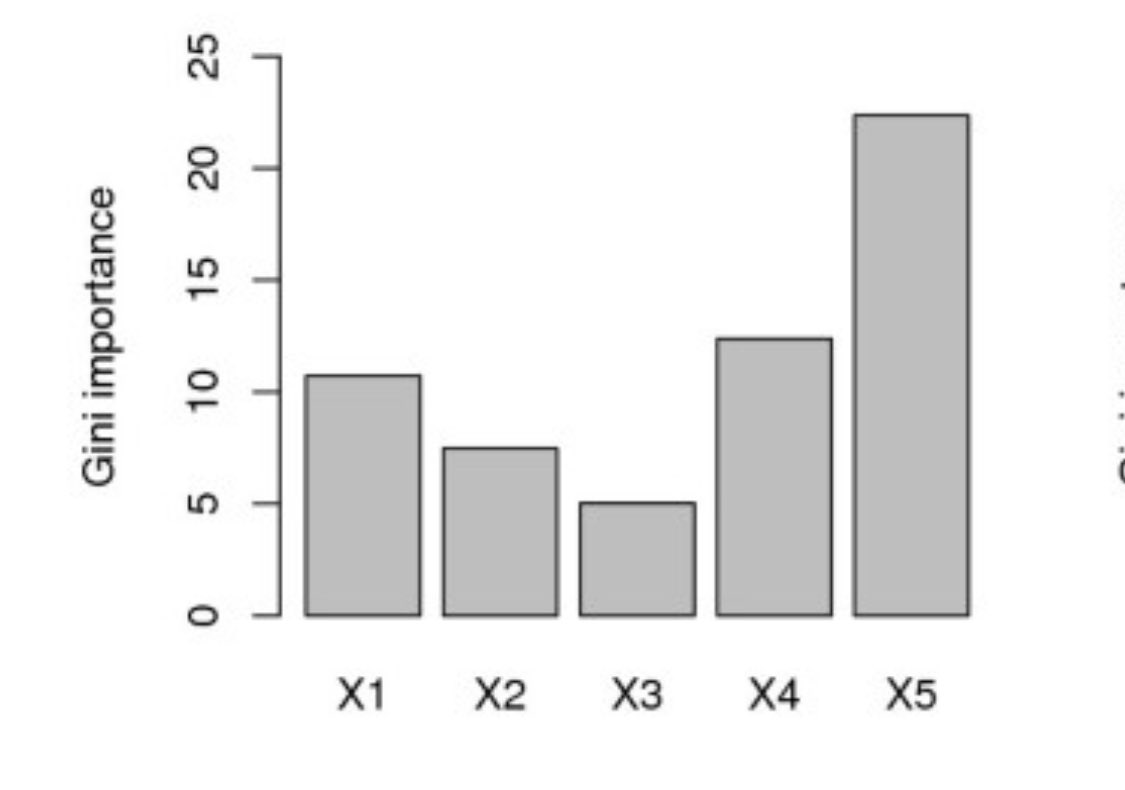
Which one is the most important?
WRONG AGAIN. It’s X2. Again, this is simulated data to ensure it is X2.
But why?! Why has the random forest failed us? It can’t possibly get worse, can it?
(The previous examples come from Strobl et al: bmcbioinformatics.biomedcentral.com/articles/10.11…)
But why?! Why has the random forest failed us? It can’t possibly get worse, can it?
(The previous examples come from Strobl et al: bmcbioinformatics.biomedcentral.com/articles/10.11…)
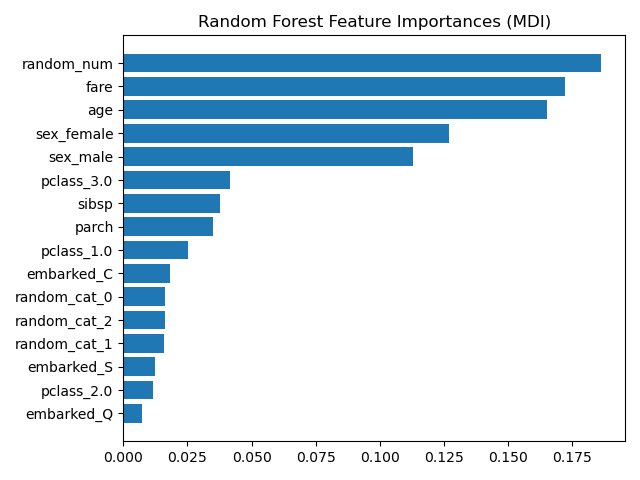
What if we added a random number to set of otherwise well-meaning variables?
You *NEVER* want to see something called “random_num” at the top of your variable importance plot.
Source: scikit-learn.org/stable/auto_ex…
You *NEVER* want to see something called “random_num” at the top of your variable importance plot.
Source: scikit-learn.org/stable/auto_ex…
So let’s talk about what went wrong. First, you need to know that there are multiple ways to calc random forest var importance.
A few common ones:
1.# splits/variable
2.Gini importance
3.Unscaled permutation imp
4.Scaled perm imp
Which is your go-to RF var imp?
A few common ones:
1.# splits/variable
2.Gini importance
3.Unscaled permutation imp
4.Scaled perm imp
Which is your go-to RF var imp?
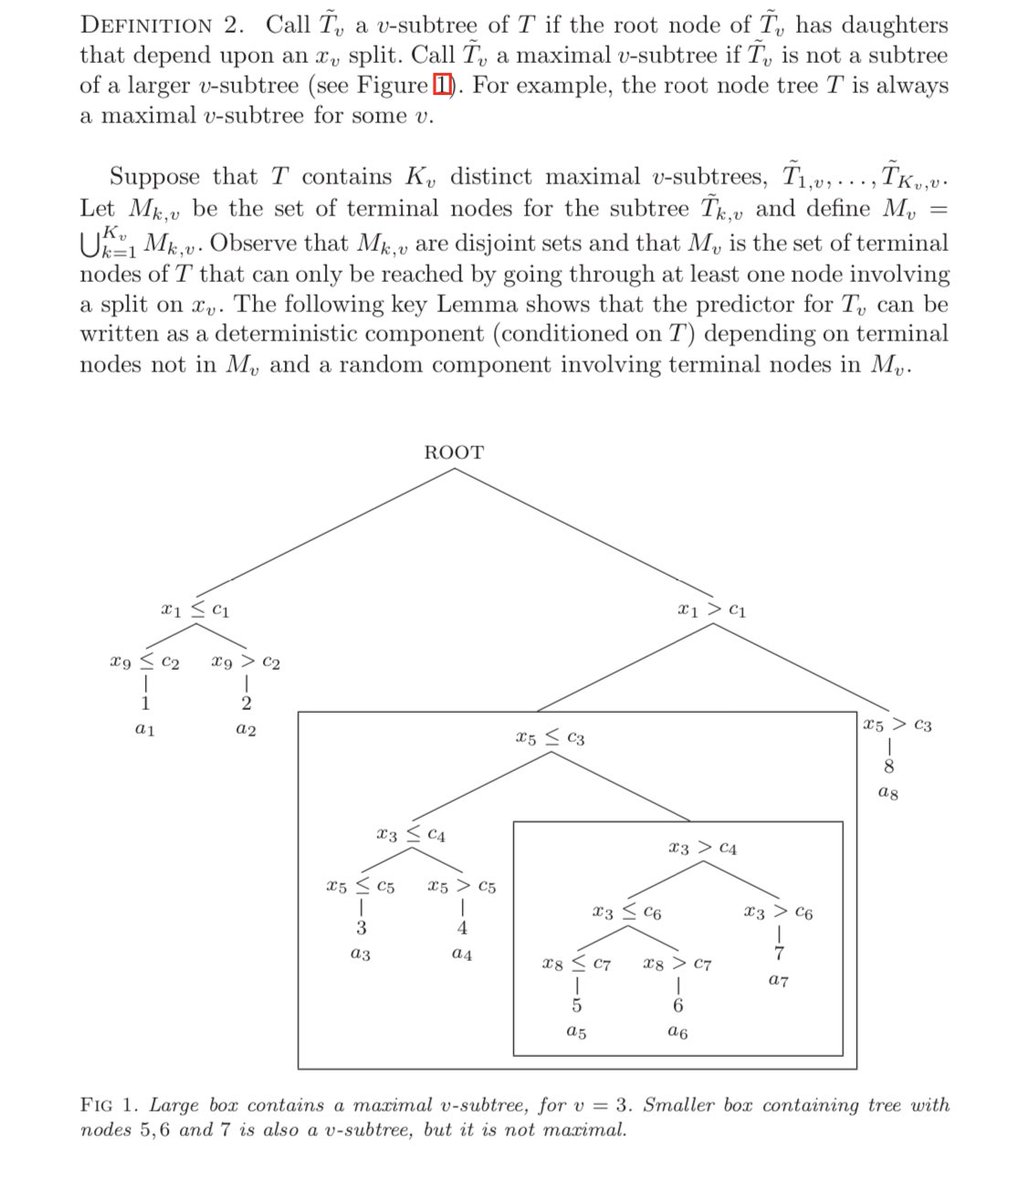
Let’s start with a quick refresher. RF is a set of CART trees where each tree is made up of nodes containing variable splits. Each tree is built from a bootstrap of the data and a set of F variables are randomly selected at each node.
After evaluating a set of splits from these F variables, the “best” split is chosen. How? We’ll come back to that.
On a side note, you may be thinking to yourself “Why are you calling it F? Isn’t that mtry?”
Don’t blame me. That’s what Breiman calls it: link.springer.com/content/pdf/10…
On a side note, you may be thinking to yourself “Why are you calling it F? Isn’t that mtry?”
Don’t blame me. That’s what Breiman calls it: link.springer.com/content/pdf/10…
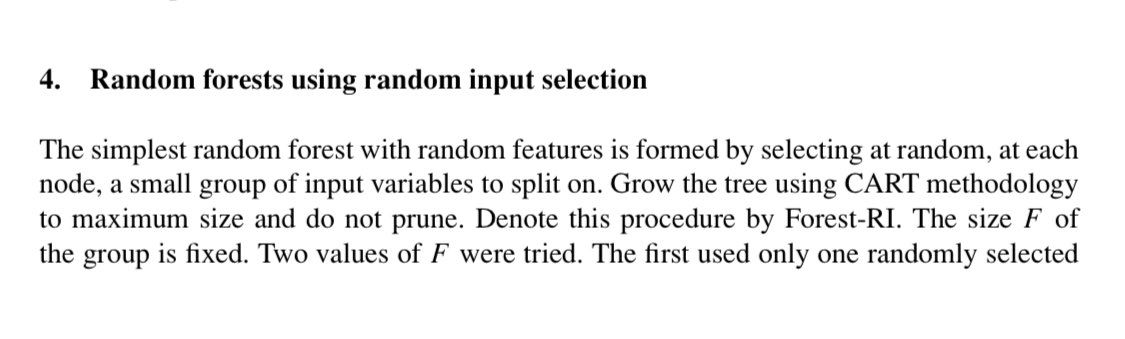
In the same paper, Breiman refers to number of predictors as *m*.. When Breiman’s code was ported to the #rstats randomForest package, *F* was named mtry and it’s been mtry ever since.
Why mtry? Bc that’s the number of m’s to try. And in his paper, Breiman tried multiple m’s.
Why mtry? Bc that’s the number of m’s to try. And in his paper, Breiman tried multiple m’s.
Now, assuming that these splits are good, we could just look at how often variables are used in the splitting process. More splits = more importance right?
Bwhahahahhah no.... This is the null example where all predictors are random numbers.
Bwhahahahhah no.... This is the null example where all predictors are random numbers.
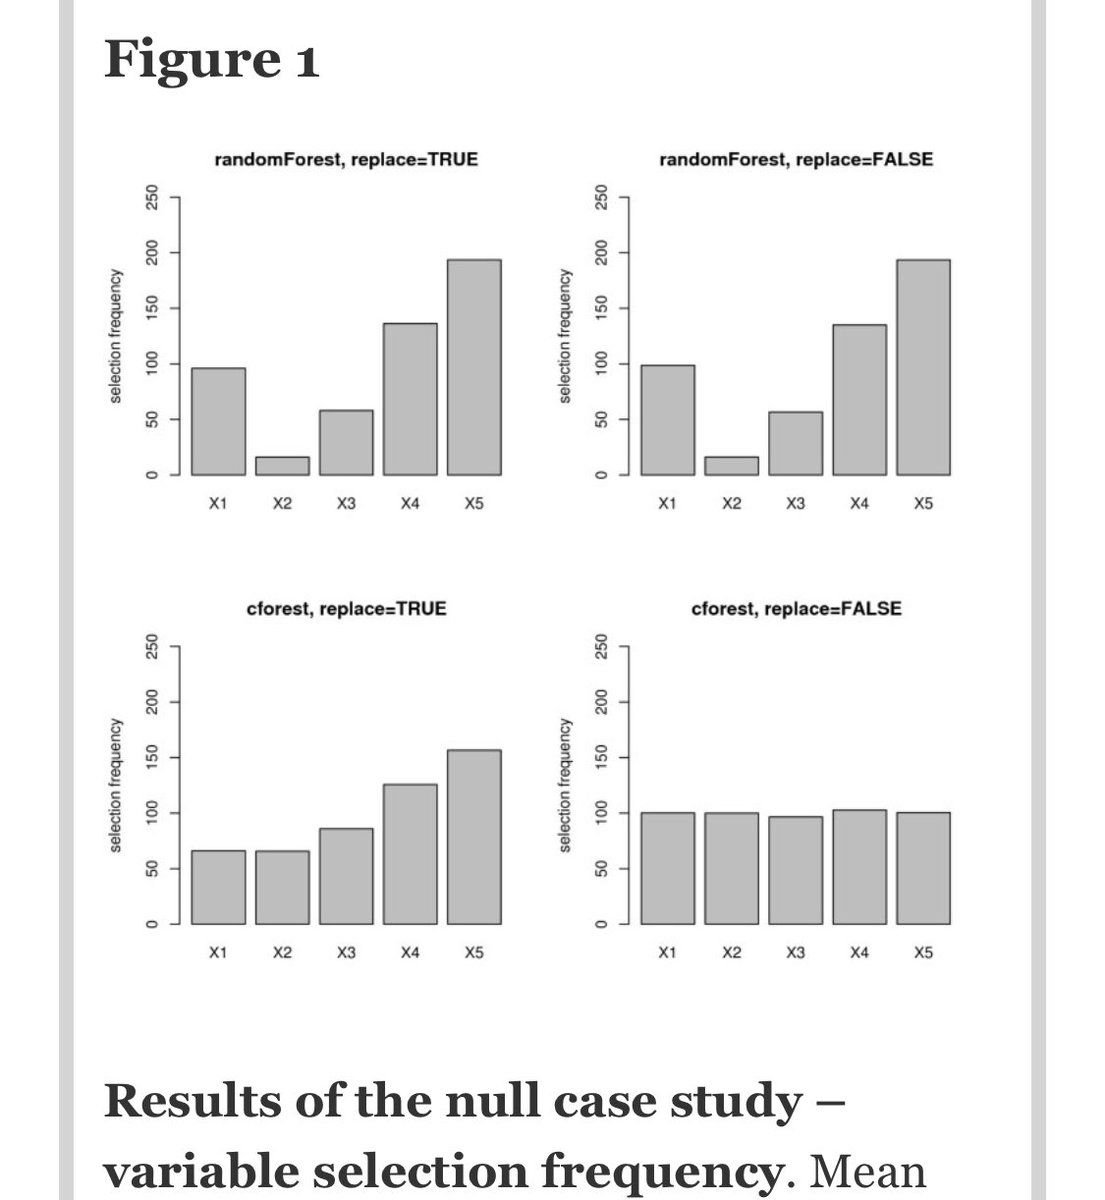
In summary:
Breiman random forest (with bootstrapping): FAIL
Breiman RF with subsampling: FAIL
Conditional inference forests with BS: FAIL
CIF with subsampling: oooh, *success*
So are you using conditional inference forests? Umm probably not.
Breiman random forest (with bootstrapping): FAIL
Breiman RF with subsampling: FAIL
Conditional inference forests with BS: FAIL
CIF with subsampling: oooh, *success*
So are you using conditional inference forests? Umm probably not.
Why not? Because their implementation in #rstats is SLOW. And remember, it’s not that CIF does way better than RF in prediction, simply in identifying variable importance better in this example. What about when X2 is the only important variable?
Again, conditional inference forests knock it out of the park when looking at # splits per variable, especially when bootstrapping is replaced by subsampling (or “subagging” as some authors like to say but we shall never repeat ever again).

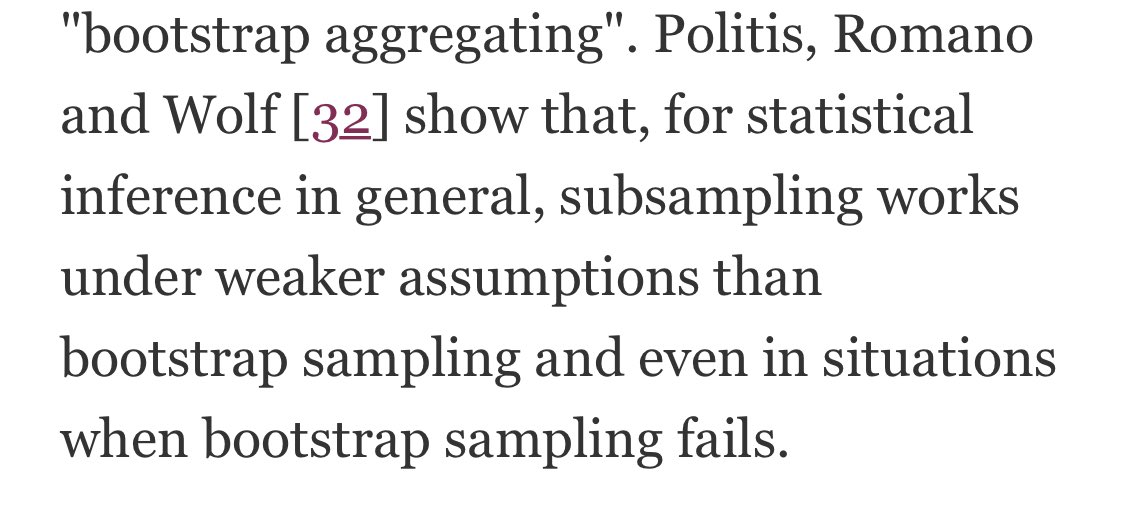
Why does subsampling work better? Strobl et al explain this by referring to others’ work showing that subsampling generally works better under weaker assumptions. One other advantage of subsampling? SPEED 🏎 🔥
By how much? Subsampling is 25% faster in the Strobl paper for randomForest and nearly twice as fast for cforest. What are the defaults in #rstats?
Bootstrap:
randomForest
randomForestSRC::rfsrc
ranger
Subsampling:
rfsrc.fast
h2o.randomForest
XGBoost
Bootstrap:
randomForest
randomForestSRC::rfsrc
ranger
Subsampling:
rfsrc.fast
h2o.randomForest
XGBoost
Ok, let’s get back on track. What about Gini importance? We know that RFs use Gini “impurity” to choose splits. Why not use it to determine variable importance? Well, remember our opening examples that were all failures? Those were Gini var imp measures.
First of all, what is Gini impurity? It’s a *super easy* thing to calculate. It’s calculated as f*(1-f) summed over all classes where f is the probability of each class.
If your outcome is binary where 30% of ppl experience an event, then *without a model*, your Gini impurity is 0.3(1-0.3) + 0.7(1-0.3). Those numbers are the same so you could also just look at one and double it. It’s 0.42.
Another way to calculate this is 1-0.3^2 -0.7^2 but I prefer the first formula bc it more easily generalizes to multinomial situations.
Then, you find a perfect split that sends all cases to the left and all non-cases to the right. Then, Gini index of the left child = 1(1-1) + 0(1-0) and right child = 0(1-0) + 1(1-0). Summing the left and right children, your new Gini index is 0! Woohoo!
So is the Gini importance of that split = 0?
No. It’s equal to 0.42 (value before split) minus 0 (value after split), so impurity reduction (or Gini “gain”) is 0.42. You choose the splits with the highest reduction in Gini impurity.
No. It’s equal to 0.42 (value before split) minus 0 (value after split), so impurity reduction (or Gini “gain”) is 0.42. You choose the splits with the highest reduction in Gini impurity.
For each variable, you repeat this process for each variable across all nodes where that variable was used for splitting *and* across all trees. Doing this, you arrive at some large number. That’s the huge importance number you commonly see in your output.
This is often rescaled (largest number to 1), which is often included in your output. And then this is often rescaled such that the quantities add up to 100% so that you can rattle off the “percent importance” of a variable.
So Gini “gain” is calculated just on way, right? Not quite. In this LECTURE (!) by Jerome Friedman, he shows how Breiman’s randomForest pkg uses equation 44, whereas other imps (eg @h2oai) use the squared version (45). projecteuclid.org/download/pdf_1…
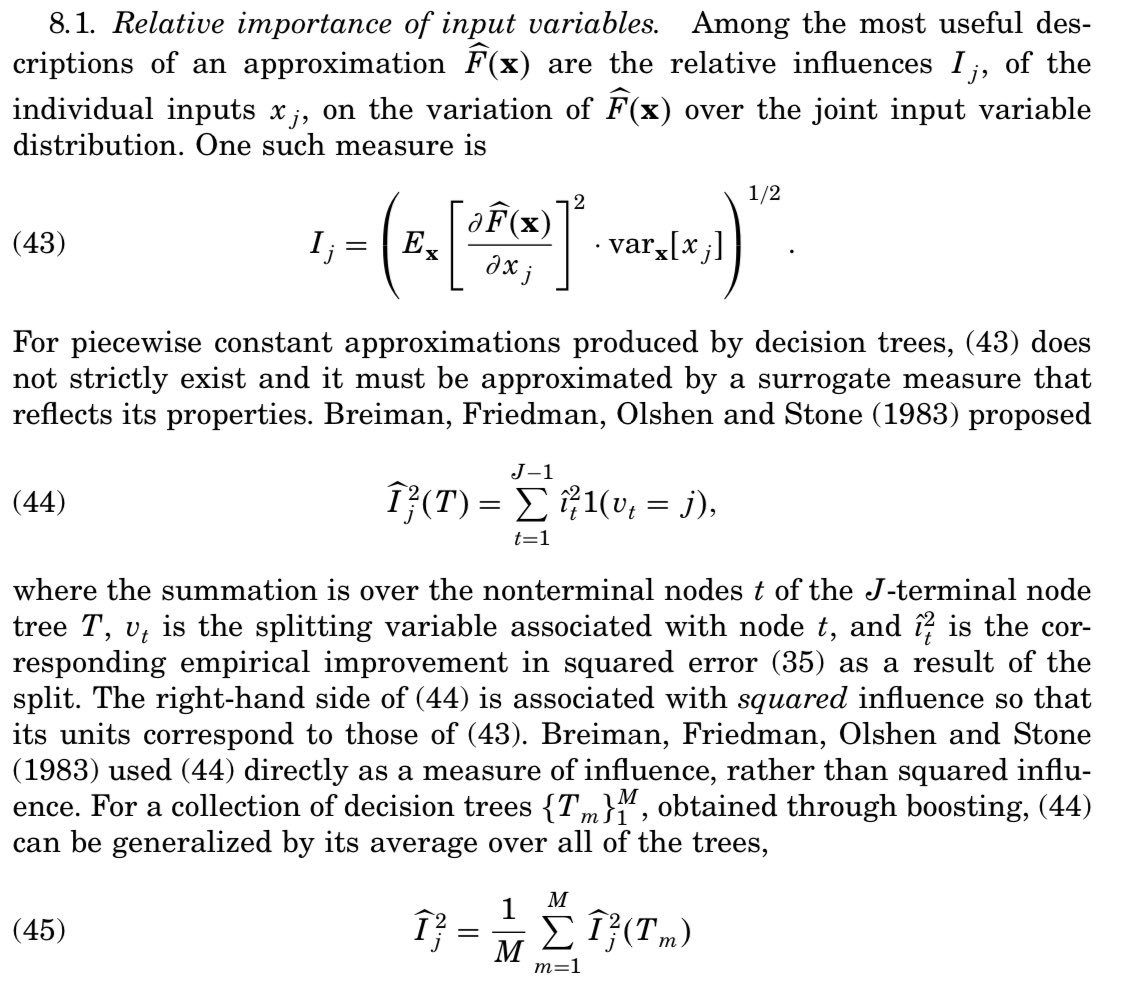
Gini “gain” seems like a natural candidate for identifying importance variables since it’s what the tree “uses” when choosing vars in the first place! Alas, Gini scores can be gamed. High-cardinality categorical variables and continuous vars are able to attain higher Gini gain.
This is why the random number made its way to the top of our variable importance plot here. Because it was random, it essentially had a unique value for each patient.

Before we move onto permutation importance, let me ask you a computational question. Does your computer have enough computational power to model a single CART decision tree consisting of 5 variables and 400,000 rows?
I once worked with a student who did *not* have the computational power to do it. The rpart #rstats package crashed his laptop. So I gave him access to my VM with 48 GB RAM. Crashed again. What do you think happened?
Turns out he left the row identifier in as one of the columns. It was coded as a categorical variable. Because rpart exhaustively searches for splits, it had to consider 400,000 choose 2 (79999800000) splits when it got to the row identifier. That’s bad news.
If he had used the scikit-learn implementation in Python, he would’ve gotten an error because in the year 2020 sklearn RF *still* can’t handle categorical variables.
But one-hot coding that would’ve created *checks notes* 400,000 dummy variables so yeah the lesson is never include your row identifier variable as a predictor.
Lastly, what is permutation importance in an RF? Well, it’s slightly complicated. Remember how you built bootstrapped or subsampled trees? Well, the remainder of your data for each tree is the out of bag (oob) data.
To calculate perm imp, you first calculate the oob misclassification error up front. Then you permute variables one at a time. When a variable is important, permuting it wreaks havoc. Otherwise nothing much changes.
Subtracting mean permuted error from the original error for each variable in the oob data gives you the variable importance. This is called the unscaled permutation importance.
Since the permuted error may vary quite a bit across trees, Breiman argued that this value should be divided by the std error to “scale” it. In fact, this is the default setting in the randomForest #rstats pkg.
Both types of permutation importance seem to work well. Here’s an example of scaled perm imp when X2 is the only imp variable.
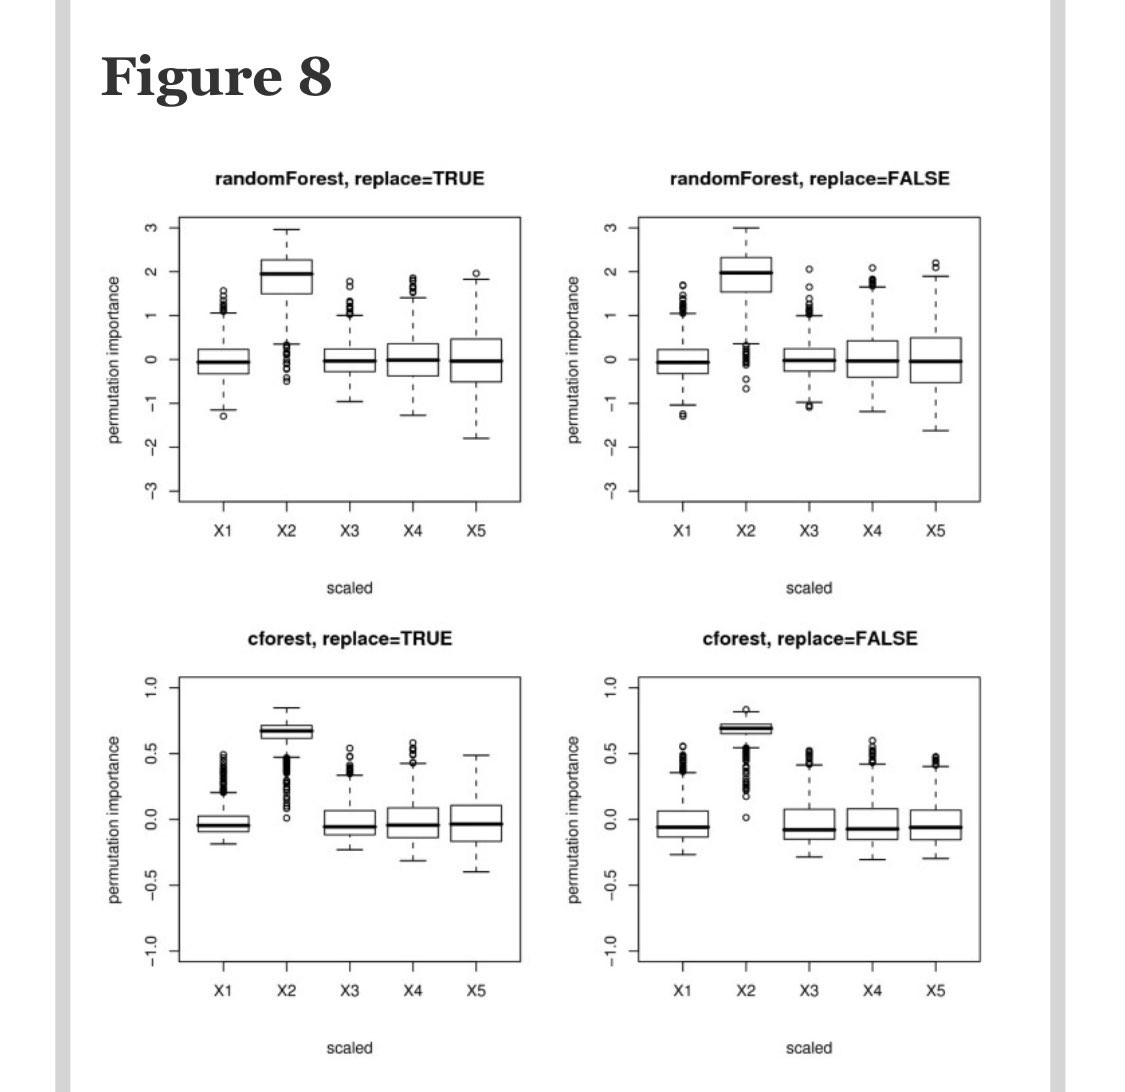
So, we should just go with permutation importance right? Well, remember how you chose to use RFs because they are great at handling multicollinearity? It’s about to bite you in the backside. Why?
Because when you permute a variable that is correlated with another variable, it *looks* as tho that var isn’t important bc the correlated var carries similar info. This is both a pro and a con but mostly a con when dealing with 100s of predictors.
scikit-learn.org/stable/auto_ex…
scikit-learn.org/stable/auto_ex…
So you’ve made it this far. Wow. Where to go next? Read about mean depth and maximal subtree var imp methods from the illustrious Hemant Ishawaran (author of the randomForestSRC package).
projecteuclid.org/download/pdfvi…
projecteuclid.org/download/pdfvi…
And read about the Janitza variable importance method implemented in the ranger package.
link.springer.com/article/10.100…
link.springer.com/article/10.100…
And read about the Boruta #rstats package for variable selection using random forests:
jstatsoft.org/article/view/v…
jstatsoft.org/article/view/v…
But most importantly, think a bit more critically the next time you see one of these plots. That “most important variable” might just be a random number. /Fin

• • •
Missing some Tweet in this thread? You can try to
force a refresh