How increasing #COVID19 cases overwhelm contact tracing (CT) & lead to runaway/accelerating epidemics. Also, how delays make CT ~useless.
(bonus: how heterogeneity can lead to highly variable timing of epidemics)
New paper from @billy_gardner_ & me.
medrxiv.org/content/10.110…
Thread
(bonus: how heterogeneity can lead to highly variable timing of epidemics)
New paper from @billy_gardner_ & me.
medrxiv.org/content/10.110…
Thread
Background:
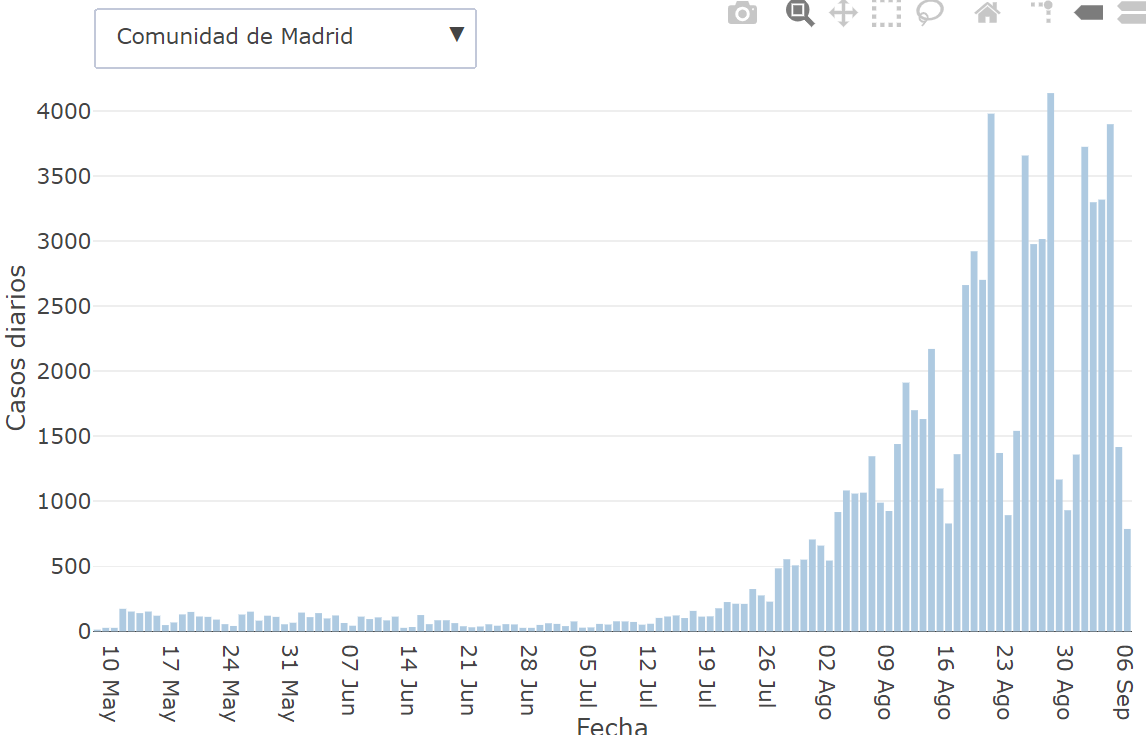
Rapid spread of COVID19 (cases/case Rt = ~2-3 every 4-6d) initially led to huge epidemics in many places (e.g. NYC, Italy, Spain, etc.) which led to shutdowns to limit transmission. However, some countries were able to limit transmission w/out shutdowns.
Rapid spread of COVID19 (cases/case Rt = ~2-3 every 4-6d) initially led to huge epidemics in many places (e.g. NYC, Italy, Spain, etc.) which led to shutdowns to limit transmission. However, some countries were able to limit transmission w/out shutdowns.
The example many point to is Singapore which implemented a very strong public health response, including aggressive contact tracing (CT). Other countries (S Korea, Hong Kong, etc.) also have used CT effectively.
statnews.com/2020/03/23/sin…
statnews.com/2020/03/23/sin…
A huge Q is: to what extent one can limit transmission using just testing & isolating of symptomatic cases & tracing & quarantining their contacts (T-CT-I/Q). To what extent are lockdowns or social distancing required to keep R0 or Rt<1?
@mlipsitch & others have been skeptical that T-CT-I/Q could ever be enough to control COVID19 on its own & unfortunately evidence has been supportive of their skepticism.
Early work by @LucaFerrettiEvo @ChristoPhraser suggested manual T-CT-I/Q would be too slow; digital CT is needed:
science.sciencemag.org/content/368/64…
science.sciencemag.org/content/368/64…
@AdamJKucharski et al also examined potential efficacy of T-CT-I/Q & suggested a very high fraction of symptomatic cases needed to isolate & high fraction of contacts be traced & quarantined to get Rt<1.
thelancet.com/journals/lanin…
thelancet.com/journals/lanin…
Studies on T-CT-I/Q sometimes examine variation in efficacy (e.g. study in previous tweet), but I don't know of any that explicitly examine how efficacy might change as the number of cases increases. This is the focus of our paper: how does CT efficacy & Rt change as cases rise?
This Q is highly relevant b/c non-digital/manual CT-Q is a time-consuming process. To successfully reach contacts, communicate that they had contact w/ case & may be infected &, critically, provide services so they can safely quarantine can take ~1 hr/contact.
If there are many cases & each case has many contacts one may need a huge number of contact tracers to reach contacts before they transmit to others.
How many are needed & under what circumstances is CT effective in reducing Rt?
How many are needed & under what circumstances is CT effective in reducing Rt?
You probably read one of the many articles about states hiring armies of contact tracers to try to control COVID19 in April/May:
theguardian.com/world/2020/may…
politico.com/states/califor…
theguardian.com/world/2020/may…
politico.com/states/califor…
There were many targets: 15 tracers/100,000 people in CA; 30/100,000 in NYC. Would this be enough?
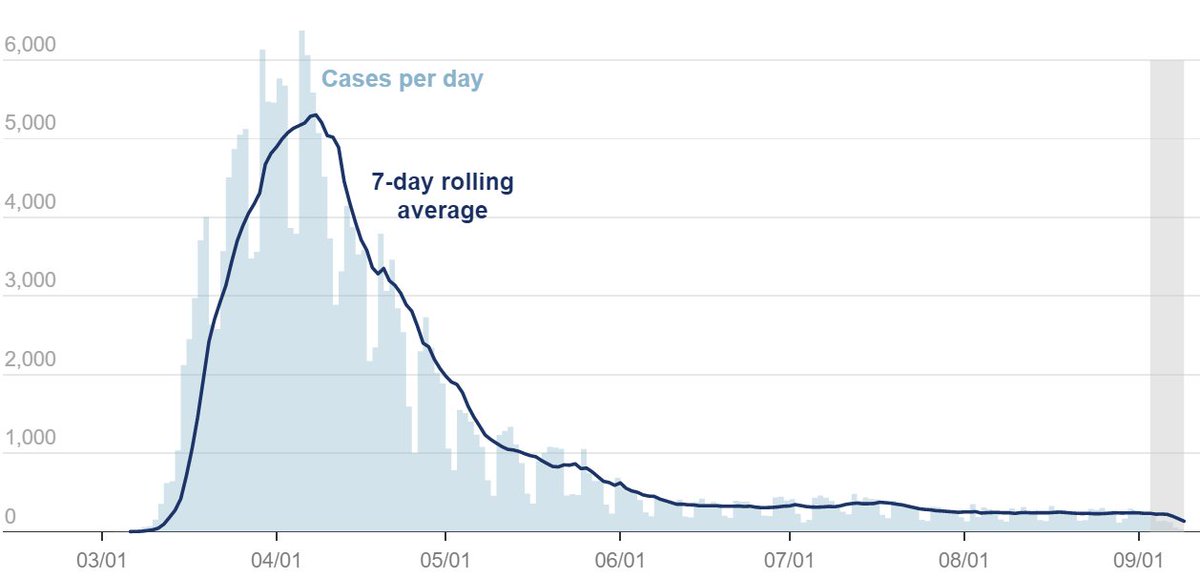
The answer, of course, is it depends on how many cases there are. A key reason we flattened the curve was to get the # of cases down low enough so that CT could be effective.
The answer, of course, is it depends on how many cases there are. A key reason we flattened the curve was to get the # of cases down low enough so that CT could be effective.
How many cases can a team of tracers handle & keep Rt<1? To answer this we used what is now a "standard" compartmental model of COVID that includes the key biology needed to try to address this Q: pre-symptomatic & asymptomatic transmission, mild & severe stages of infection.
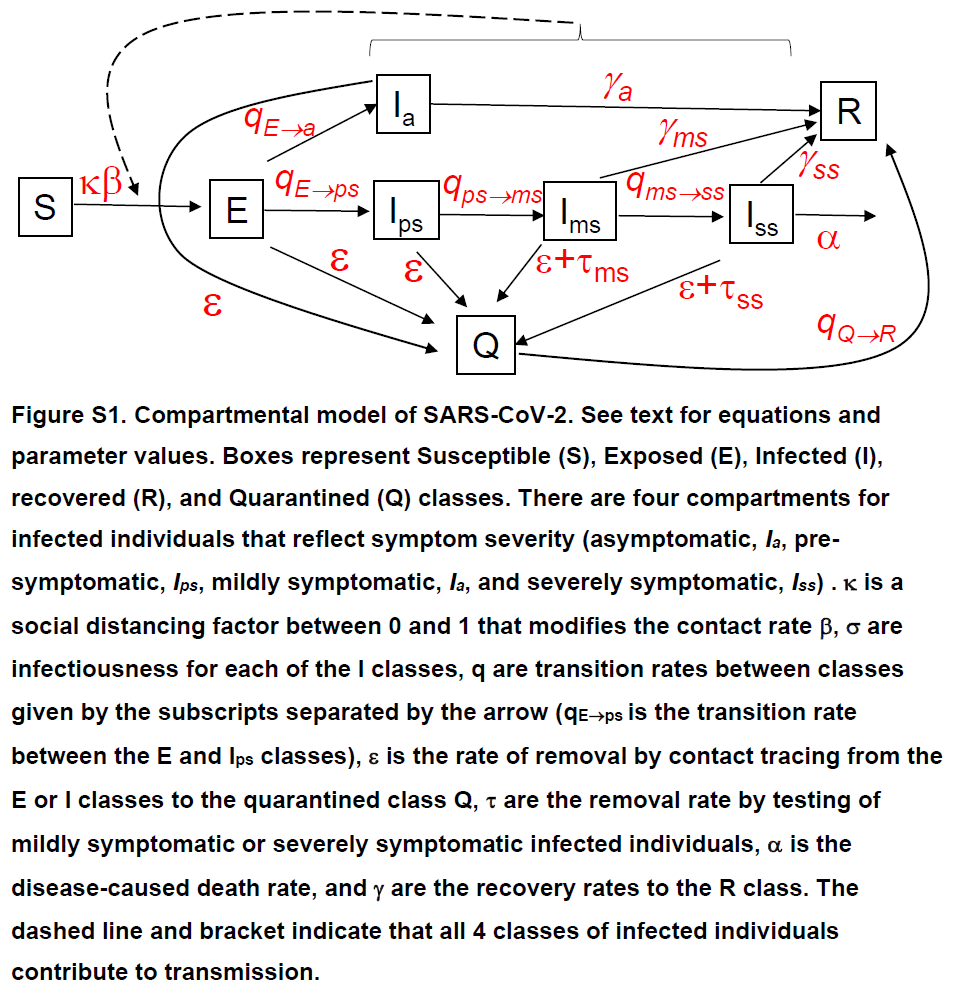
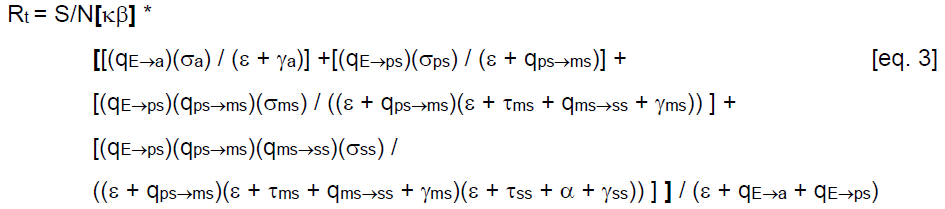
The removal rate of infected individuals by contact tracing is focus of the analysis. The key detail is that it takes time to reach & quarantine contacts & delays b/w symptom onset of case & testing (including receiving results) lead to contacts spreading virus before being Q.
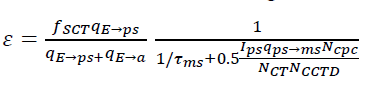
We use next-generation matrix techniques to solve for analytical expression for Rt & explored how Rt changed w/ # of cases & delays b/w symptom onset in case & CT.
Results
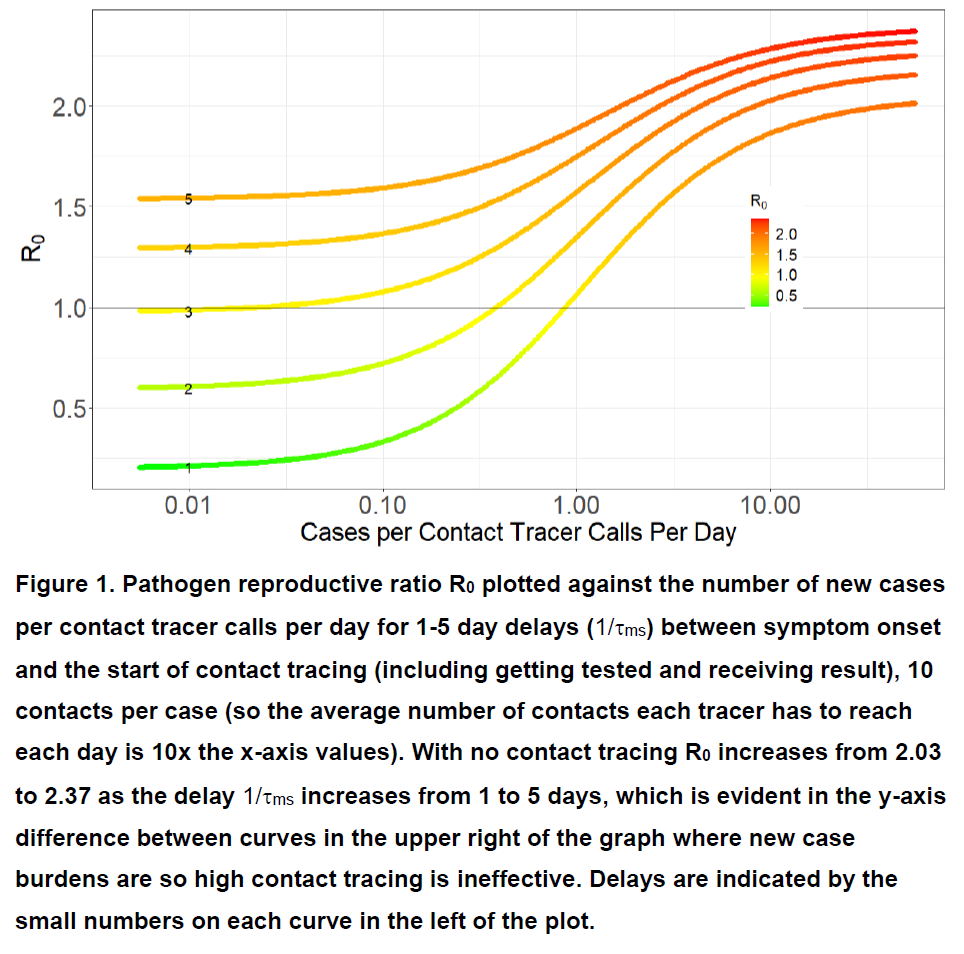
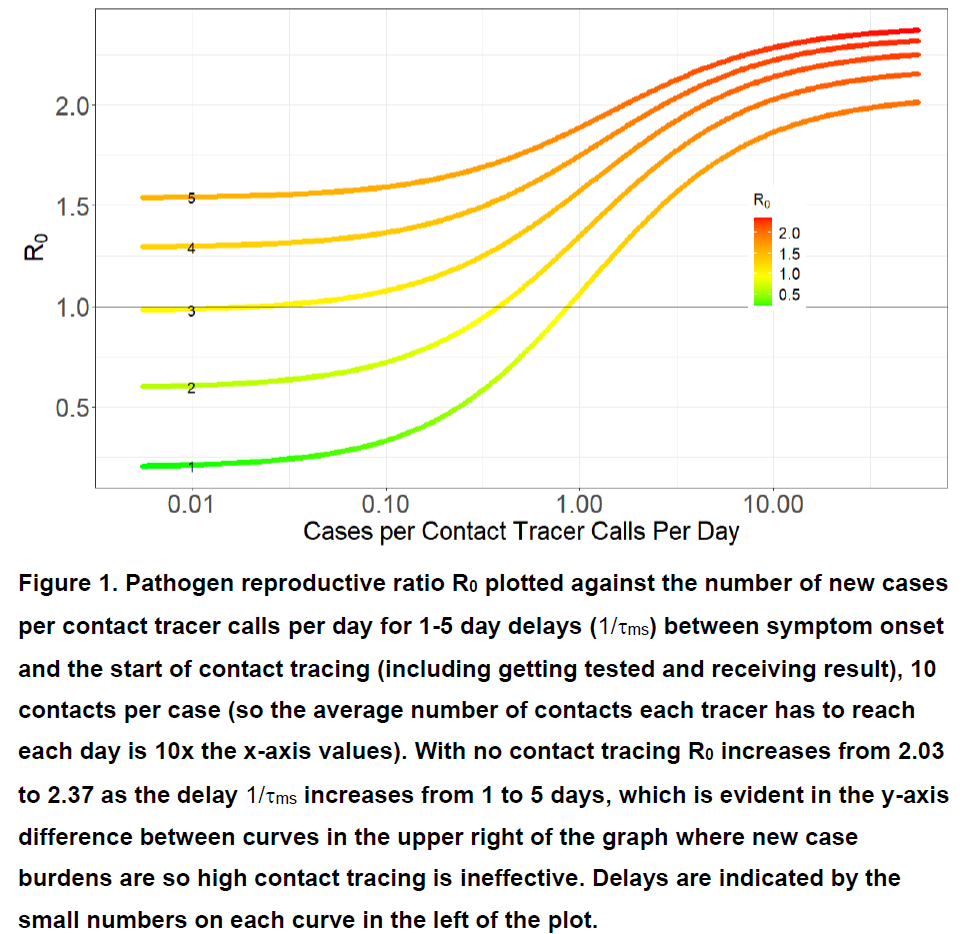
R0 increases as # cases increase (b/c it takes longer to reach an average contact) & as expected it increases faster for more contacts/case (see @joel_mossong paper for study of # contacts in Lux in 2020 journals.plos.org/plosone/articl…).
R0 increases as # cases increase (b/c it takes longer to reach an average contact) & as expected it increases faster for more contacts/case (see @joel_mossong paper for study of # contacts in Lux in 2020 journals.plos.org/plosone/articl…).
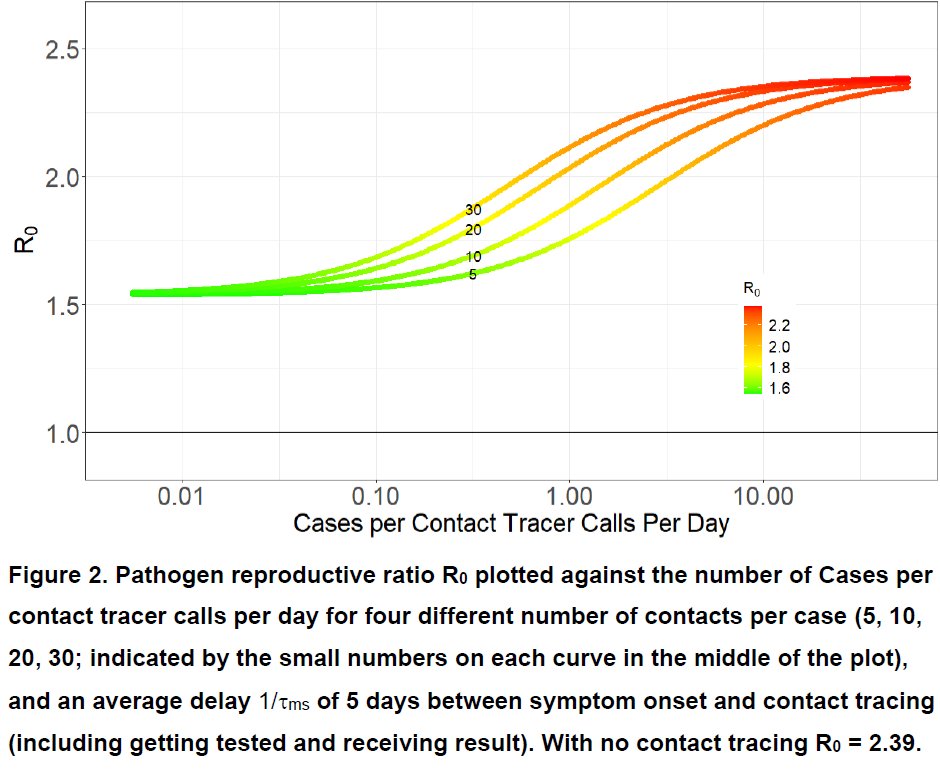
This shows that # of tracers needed is not static; need surge capacity as cases rise.
Alternatively it shows how low we have to flatten curve for fixed # of tracers for them to be effective. Otherwise many contacts are reached after their infectious period is over.
Alternatively it shows how low we have to flatten curve for fixed # of tracers for them to be effective. Otherwise many contacts are reached after their infectious period is over.
State health depts can use relationship to see where counties are (see paper for details) - excess capacity can be shifted w/ little effect to higher case burden counties relative to capacity. High case:capacity areas need more capacity or social distancing to bring R0/Rt down.
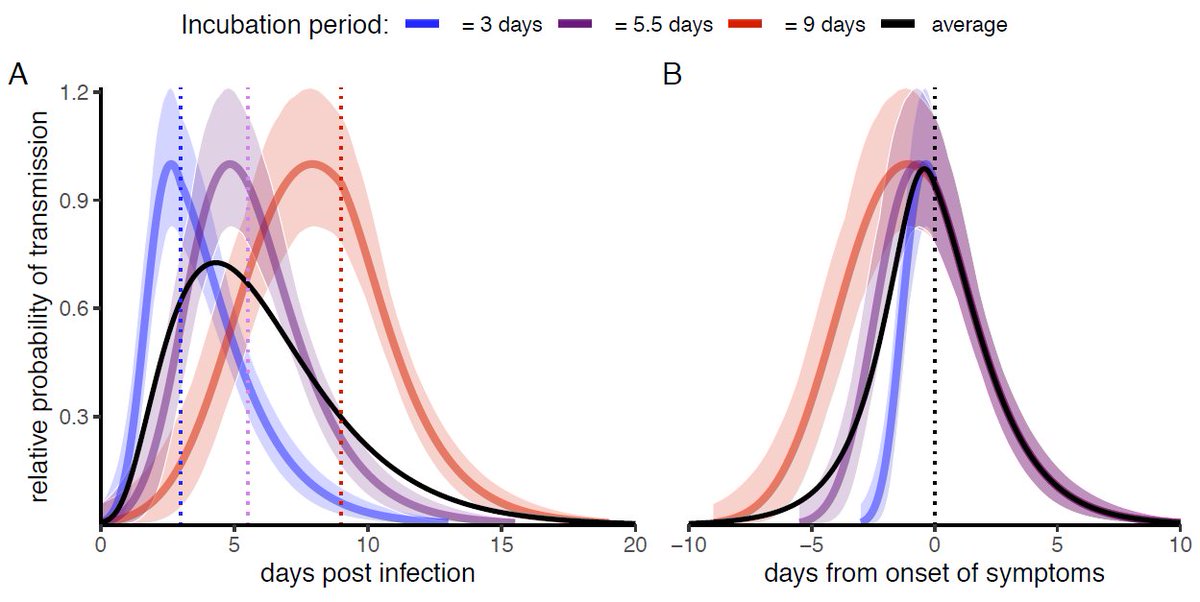
Window to reach contacts depends on timing of transmission relative to case onset; more recent contacts could be quarantined during latent period before they have become infectious (priority for tracing contacts depends on time of contact b/c infectiousness varies over time).
@JoannaMasel has paper on "risk scoring" and how digital contact tracing can take advantage of this temporal variation in infectiousness to prioritize contacts that are more likely to have been infected:
medrxiv.org/content/10.110…
medrxiv.org/content/10.110…
Recent paper I co-authored w/ @LucaFerrettiEvo @ChristoPhraser shows that latent period increases w/ incubation period for COVID19.
medrxiv.org/content/10.110…
medrxiv.org/content/10.110…
Also v important is delays b/w symptom onset of case & CT. If there is very short delay, (1d), which would require rapid (at-home?) tests used by all symptomatic cases on day of onset, T-CT-I/Q can be hugely effective. Unfortunately, we don't have those.

Data from CA where I live suggest that delay b/w symptom onset & beginning of CT has varied b/w 5 & 10 days over past 6 months. Line with delay of 5d shows that T-CT-I/Q cannot bring R0<1. And it gets worse if not all mildly symptomatic cases get tested&traced.
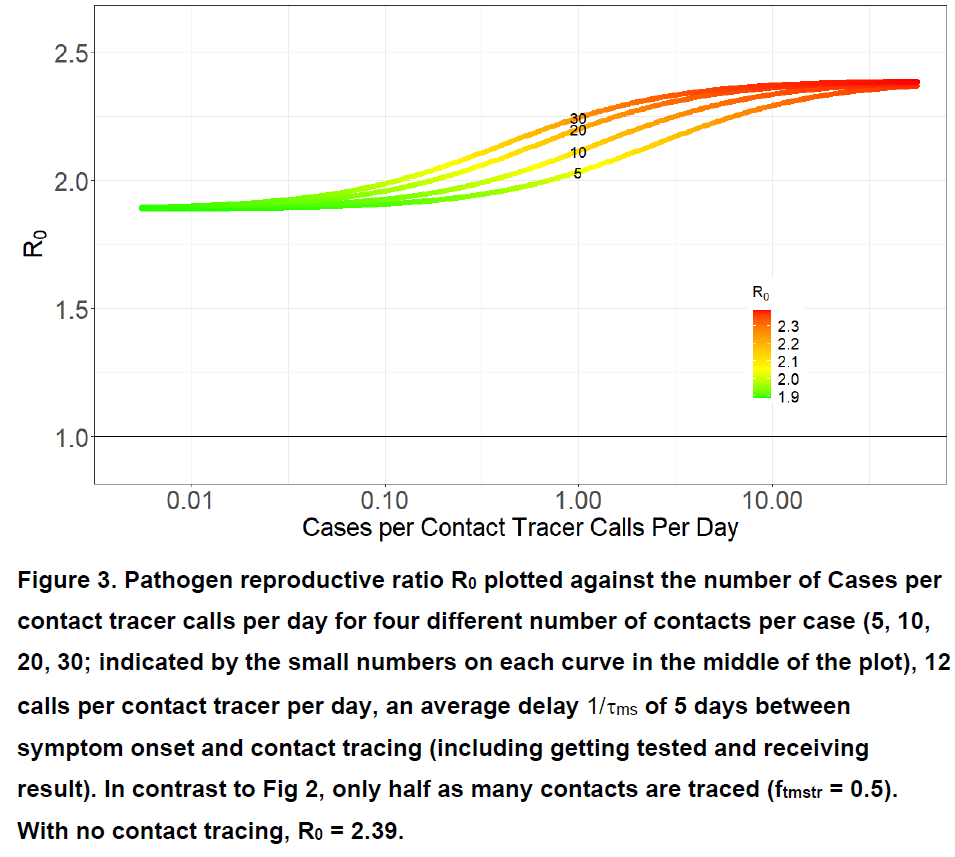
If only half of mildly symptomatic cases are traced & delay is a realistic 5d, max efficacy of T-CT-I/Q is quite small (only a 21% reduction in R0).
Conclusions 1
@mlipsitch @AdamJKucharski @bencowling88 et al are right that under current conditions in US T-CT-I/Q is totally insufficient to get R0<1. Need rapid testing-CT immediately after symptom onset & sufficient CT capacity to quickly reach current case burden.
(cont.)
@mlipsitch @AdamJKucharski @bencowling88 et al are right that under current conditions in US T-CT-I/Q is totally insufficient to get R0<1. Need rapid testing-CT immediately after symptom onset & sufficient CT capacity to quickly reach current case burden.
(cont.)
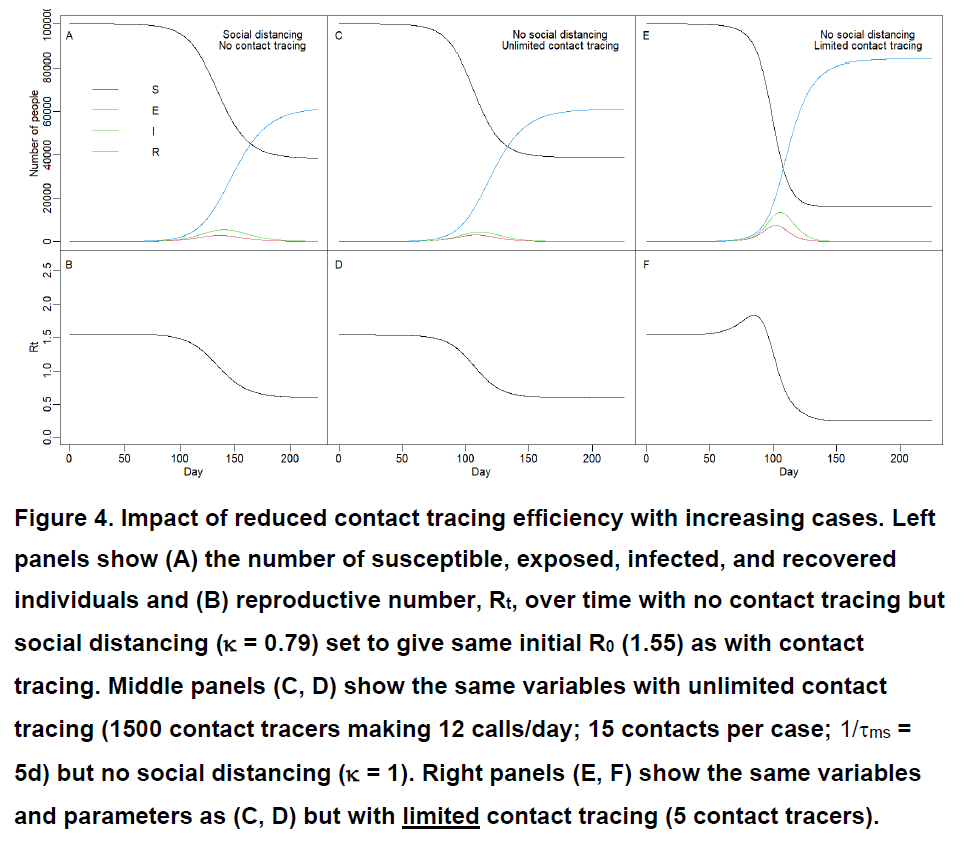
If T-CT-I/Q is insufficient to keep Rt<1, decreasing efficiency of limited capacity CT leads to accelerating epidemic where Rt increases rather than decreases as epidemic progresses. Having surge capacity of CT prevents this from occurring.
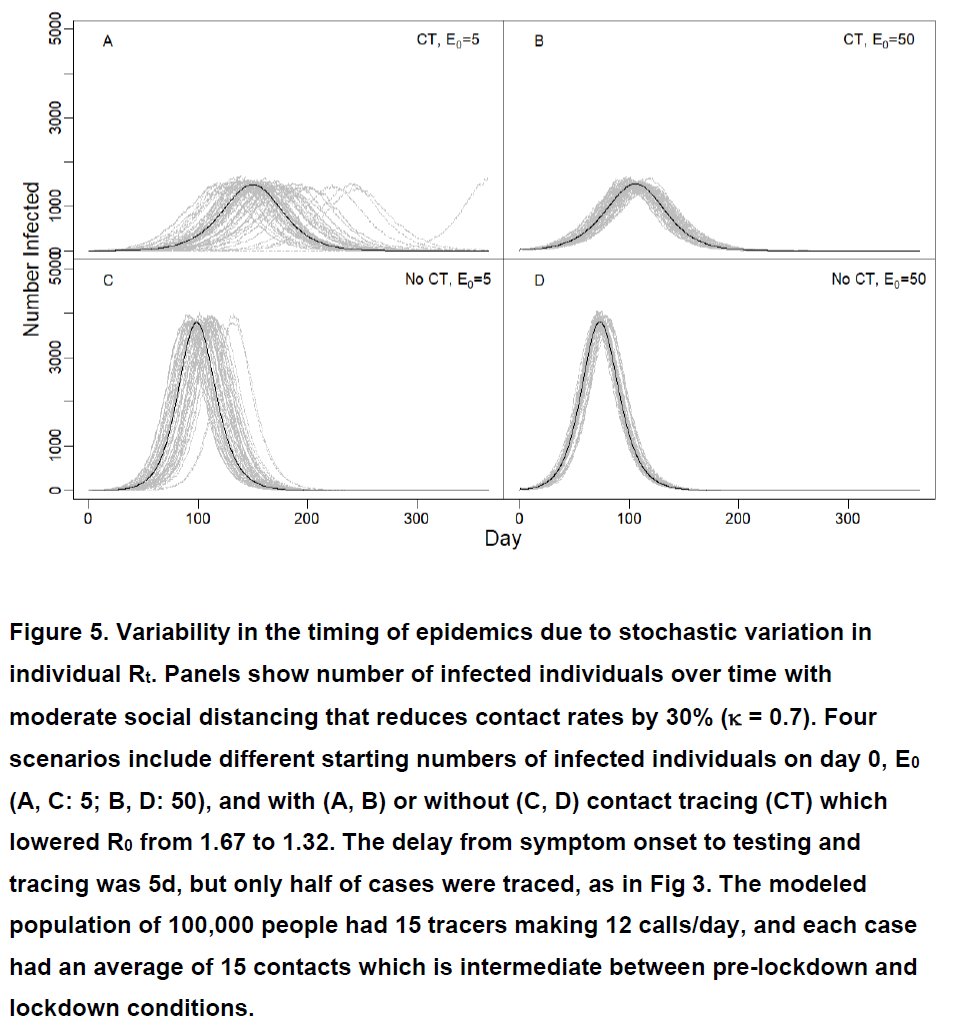
Finally, we explored how combination of T-CT-I/Q & social distancing affects timing of epidemics. If CT reduces Rt from 1.7 to 1.3 & starting infections are low, stochastic nature of COVID (a few superspreaders; many dead end chains) can give very different timing of epidemics.
Conclusions 2
-Insufficient CT capacity can lead to runaway accelerating epidemics (Rt increasing over time despite decreasing susceptible fraction), due to ever less efficient CT reaching contacts later and later as cases increase.
-Insufficient CT capacity can lead to runaway accelerating epidemics (Rt increasing over time despite decreasing susceptible fraction), due to ever less efficient CT reaching contacts later and later as cases increase.
-As @AdamJKucharski @joel_c_miller & others have shown, huge variation in timing of epidemics (or what appear to be different epidemic outcomes) can result from stochastic variation in transmission when # of infections is small.
Final conclusion
Unless digital contact tracing becomes widespread and results in quick/instant isolation, limited manual contact tracing capacity will result in decreasing efficacy of CT as cases increase. Flexible (volunteer?) CT capacity could help substantially.
Unless digital contact tracing becomes widespread and results in quick/instant isolation, limited manual contact tracing capacity will result in decreasing efficacy of CT as cases increase. Flexible (volunteer?) CT capacity could help substantially.
Caveats:
There are many.
Please see paper for details (medrxiv.org/content/10.110…) & remember this is a pre-print.
We welcome feedback to improve ms.
There are many.
Please see paper for details (medrxiv.org/content/10.110…) & remember this is a pre-print.
We welcome feedback to improve ms.
• • •
Missing some Tweet in this thread? You can try to
force a refresh