N Period High Low breakout strategy: A thread
Complete credit to @theProfessorDev. I have just modified it to be more user friendly.
So, what's different in this?
- You can now backtest this strategy on the time period you want - it is no more an indicator alone 1/n
Complete credit to @theProfessorDev. I have just modified it to be more user friendly.
So, what's different in this?
- You can now backtest this strategy on the time period you want - it is no more an indicator alone 1/n
- You can also backtest this strategy for any N period high low break. Usually, you will find traders using Day/Week high and low breaks. But, I've made this strategy generic to even test a 1/2/3/4 hour high/low breakout. 2/n
Example: You can test a 5 hour high/low breakout on a 15 min TF and trade this strategy.
Find the Tradingview strategy code here - pastebin.com/g7ZBmJwA
Paste this code in tradingview pinescript section and add to chart 3/n
Find the Tradingview strategy code here - pastebin.com/g7ZBmJwA
Paste this code in tradingview pinescript section and add to chart 3/n
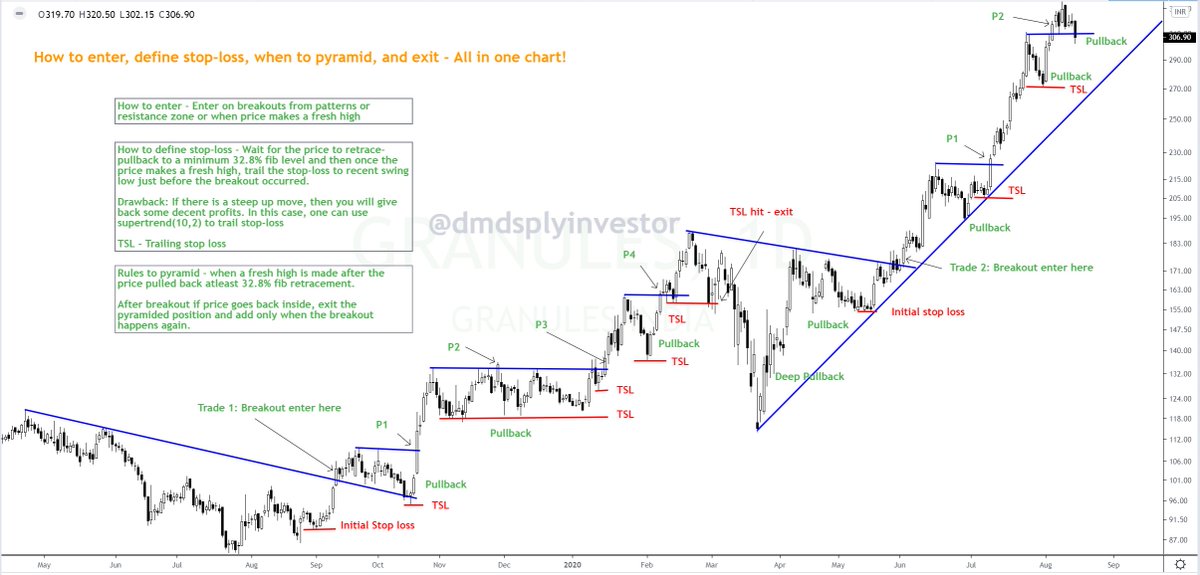
How to use it?
Let's say you want to test 5-day High and 2-day Low breakout on a 15 min TF.
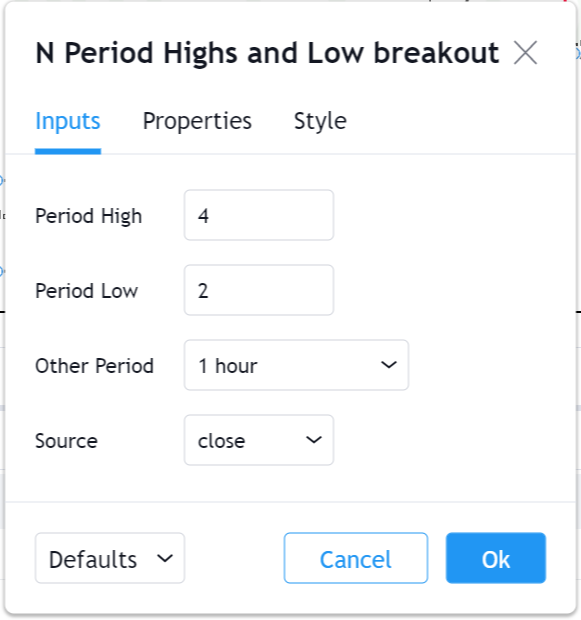
Select the following in settings
Period High: Input 5
Period Low: Input 2
Other Period: Select 1 day
Source: Select Close (closing price)
Select 15 min TF in tradingview 4/n
Let's say you want to test 5-day High and 2-day Low breakout on a 15 min TF.
Select the following in settings
Period High: Input 5
Period Low: Input 2
Other Period: Select 1 day
Source: Select Close (closing price)
Select 15 min TF in tradingview 4/n
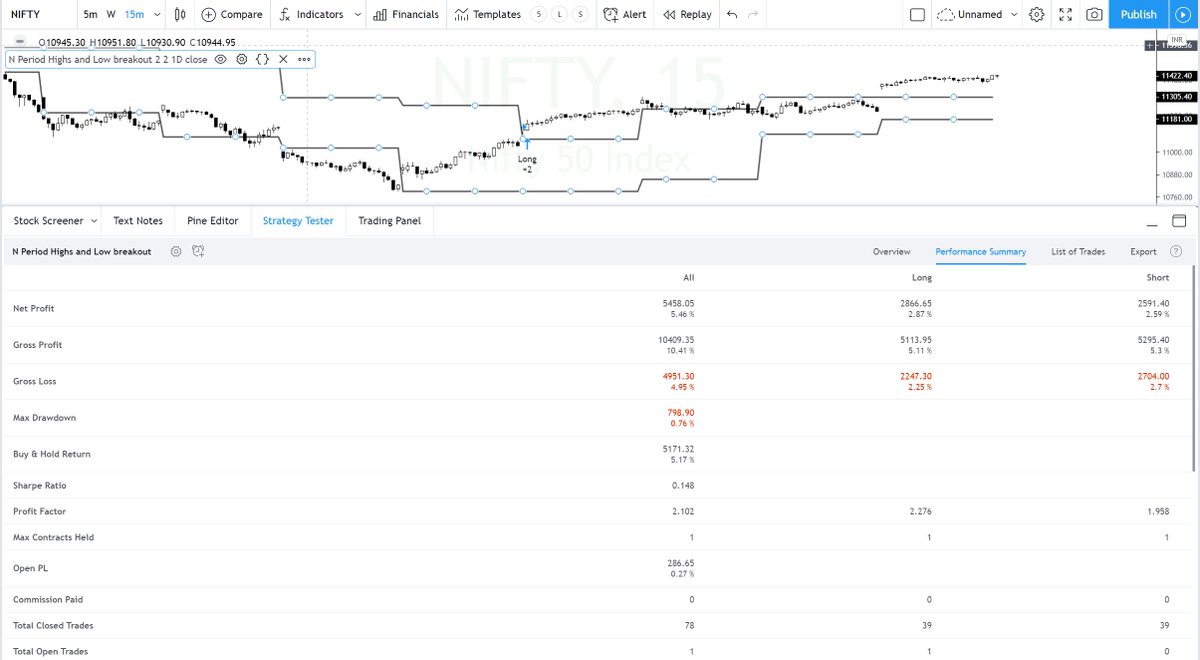
Sample results for 2 days/high low breakout on 15 min Timeframe 5/n
• • •
Missing some Tweet in this thread? You can try to
force a refresh