@HOMOCOSMICUSv2 @OskaArcher oh thank you! I've been hitting refresh on sci-hub all day ;-)
Shall read through it with a nice beverage to balance things out…
Shall read through it with a nice beverage to balance things out…
@HOMOCOSMICUSv2 @OskaArcher ok, so iamma gunna start my tweet storm here.
First copy of the article/opinion piece/doesn't deserve to be called more than that. That link probably won't last & this'll hurt Nature's business model just a little bit too. 😼 1/×
First copy of the article/opinion piece/doesn't deserve to be called more than that. That link probably won't last & this'll hurt Nature's business model just a little bit too. 😼 1/×


@HOMOCOSMICUSv2 @OskaArcher screen grabs in the order as printed on the page (so some back-n-forth might be called for) 2/×


@HOMOCOSMICUSv2 @OskaArcher Before getting stuck in, something nice …which would be what is now my official journal reading drinking beer. Delicious. 😸

@HOMOCOSMICUSv2 @OskaArcher I'm focusing on what I see as the glaring fundamental flaw in this published opinion, but there are others, the most significant of which was made here in this excellent tread on the same piece. 5/×
https://twitter.com/gilbeaq/status/1313457741432791043
@HOMOCOSMICUSv2 @OskaArcher The crux of it is here (highlighted text), where low GDP nations have rising emissions even as nuclear increases. And that's the basis on which they generate the headlines of the last 48 hours. 6/×

@HOMOCOSMICUSv2 @OskaArcher (side note: I'm making a deliberate effort to use as much neutral language as possible …this is very different to the words I'm saying in my head. Feel free to fill in the blanks. It's probably the beer making me tweet calmer.)
@HOMOCOSMICUSv2 @OskaArcher So here's the sanity check that should have occurred at some point.
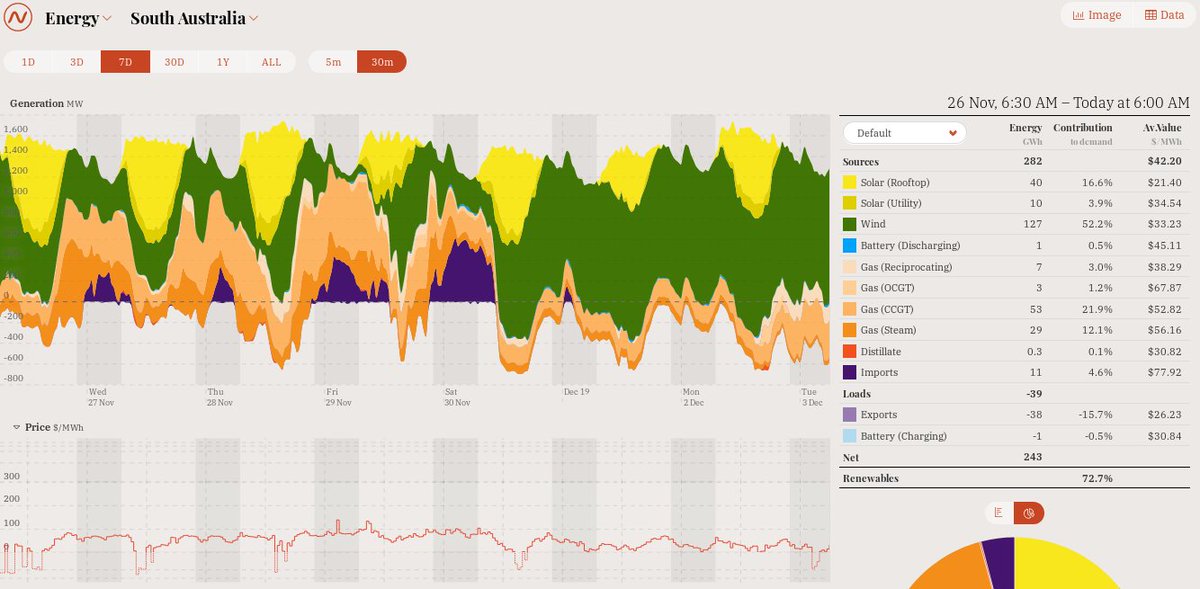
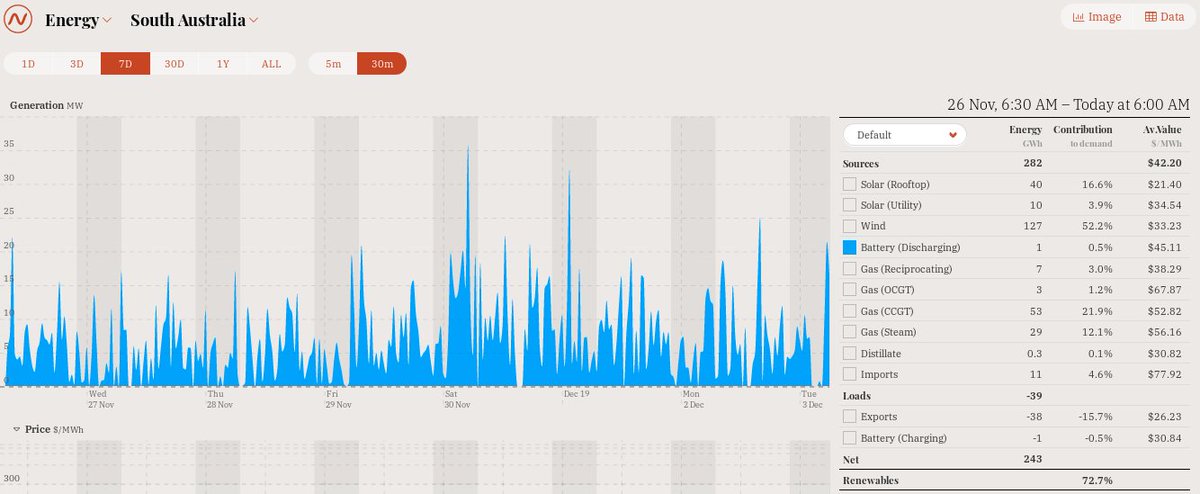
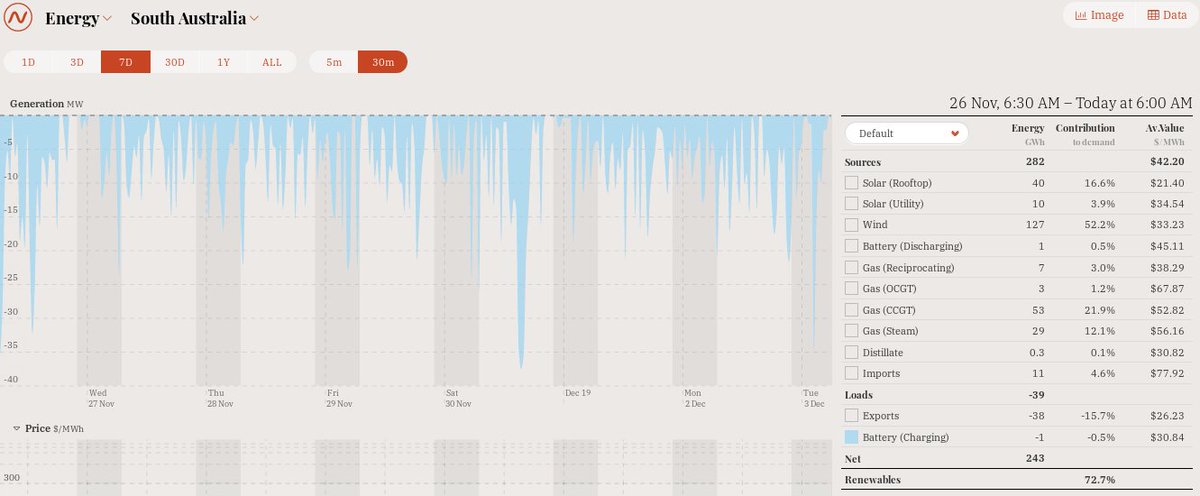
High GDP nations: established grid, low (if any) growth in electricity demand
Low GDP nations: (rapidly) increasing demand without much (or any) pre-existing infrastructure. 7/×
High GDP nations: established grid, low (if any) growth in electricity demand
Low GDP nations: (rapidly) increasing demand without much (or any) pre-existing infrastructure. 7/×
@HOMOCOSMICUSv2 @OskaArcher That's the question you ask *before* starting fancy regression analysis. You would save yourself a decent amount of time & effort.
Where the high GDP nation would get a benefit from fuel saving due to (intermittent) renewables, developing nations have more to do. 8/×
Where the high GDP nation would get a benefit from fuel saving due to (intermittent) renewables, developing nations have more to do. 8/×
@HOMOCOSMICUSv2 @OskaArcher That also ignores the clearly problematic nature of lumping hydro with other renewables like solar & wind. That should have been obvious from the get go.
But back to the main flaw. Low GDP nations with more nuclear & higher CO₂ emissions.
Exhibit A: China naturally. 9/×
But back to the main flaw. Low GDP nations with more nuclear & higher CO₂ emissions.
Exhibit A: China naturally. 9/×
@HOMOCOSMICUSv2 @OskaArcher Any dataset with China in there is going to be weighted heavily by how their electricity demand has been met. And, especially in the 2000-2014 period selected, that's been mostly by using coal. So higher emissions. No mystery here.
Some data follows. 10/×
Some data follows. 10/×
@HOMOCOSMICUSv2 @OskaArcher 2012
These are *enormous* numbers. That's Petawatt-hours of electricity you are seeing. 11/×
chinaenergyportal.org/en/2012-detail…
These are *enormous* numbers. That's Petawatt-hours of electricity you are seeing. 11/×
chinaenergyportal.org/en/2012-detail…

@HOMOCOSMICUSv2 @OskaArcher 2014
Note lots of nuclear & lots of solar & wind too. Just much more coal. And China's data makes more impact on the smaller number of nuclear nations, than it does with a larger group of renewables nations. 12/×
chinaenergyportal.org/en/2014-detail…
Note lots of nuclear & lots of solar & wind too. Just much more coal. And China's data makes more impact on the smaller number of nuclear nations, than it does with a larger group of renewables nations. 12/×
chinaenergyportal.org/en/2014-detail…

@HOMOCOSMICUSv2 @OskaArcher There was something in the Nature piece about a "crowding out hypothesis" too …well no, it doesn't work that way. 13/×
chinaenergyportal.org/en/2019-electr…
chinaenergyportal.org/en/2019-electr…
@HOMOCOSMICUSv2 @OskaArcher This is basically a case of nerds getting so distracted by the use of fancy tools (regression analysis), they forget to ask the right question.
It should have taken anyone doing peer review on this, under 5 minutes to see where they went so badly wrong. 14/×
It should have taken anyone doing peer review on this, under 5 minutes to see where they went so badly wrong. 14/×
@HOMOCOSMICUSv2 @OskaArcher Why that didn't happen is the real mystery here.
The authors of the piece got what they wanted though: news headlines that lots of credulous folks get to retweet & satisfy their priors. These sorts of people… twitter.com/search?q=https…
15/15
The authors of the piece got what they wanted though: news headlines that lots of credulous folks get to retweet & satisfy their priors. These sorts of people… twitter.com/search?q=https…
15/15
• • •
Missing some Tweet in this thread? You can try to
force a refresh