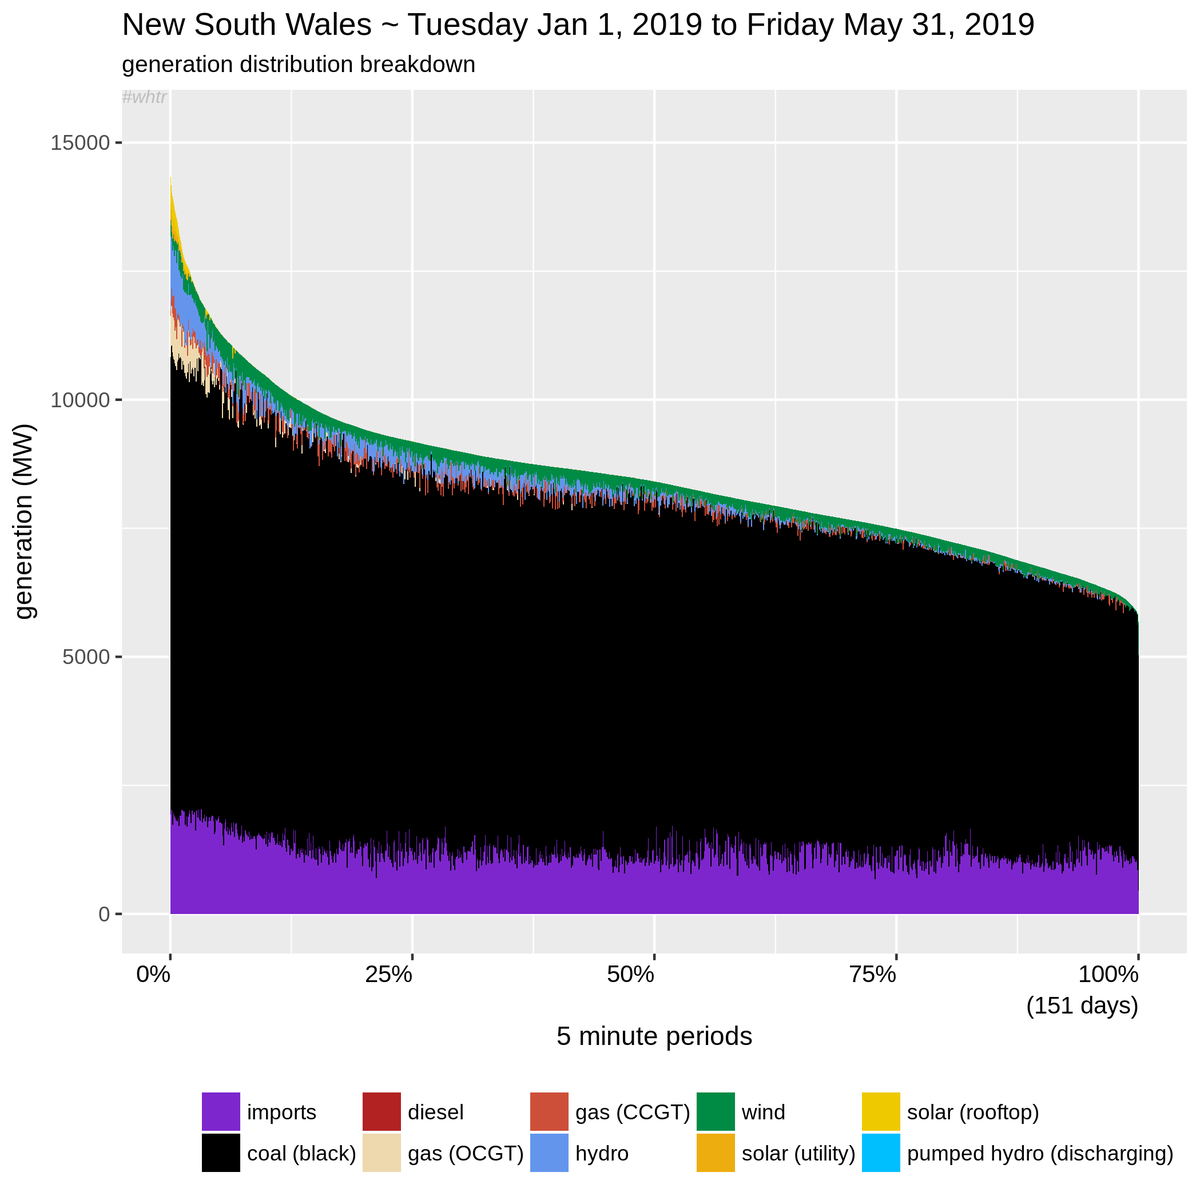
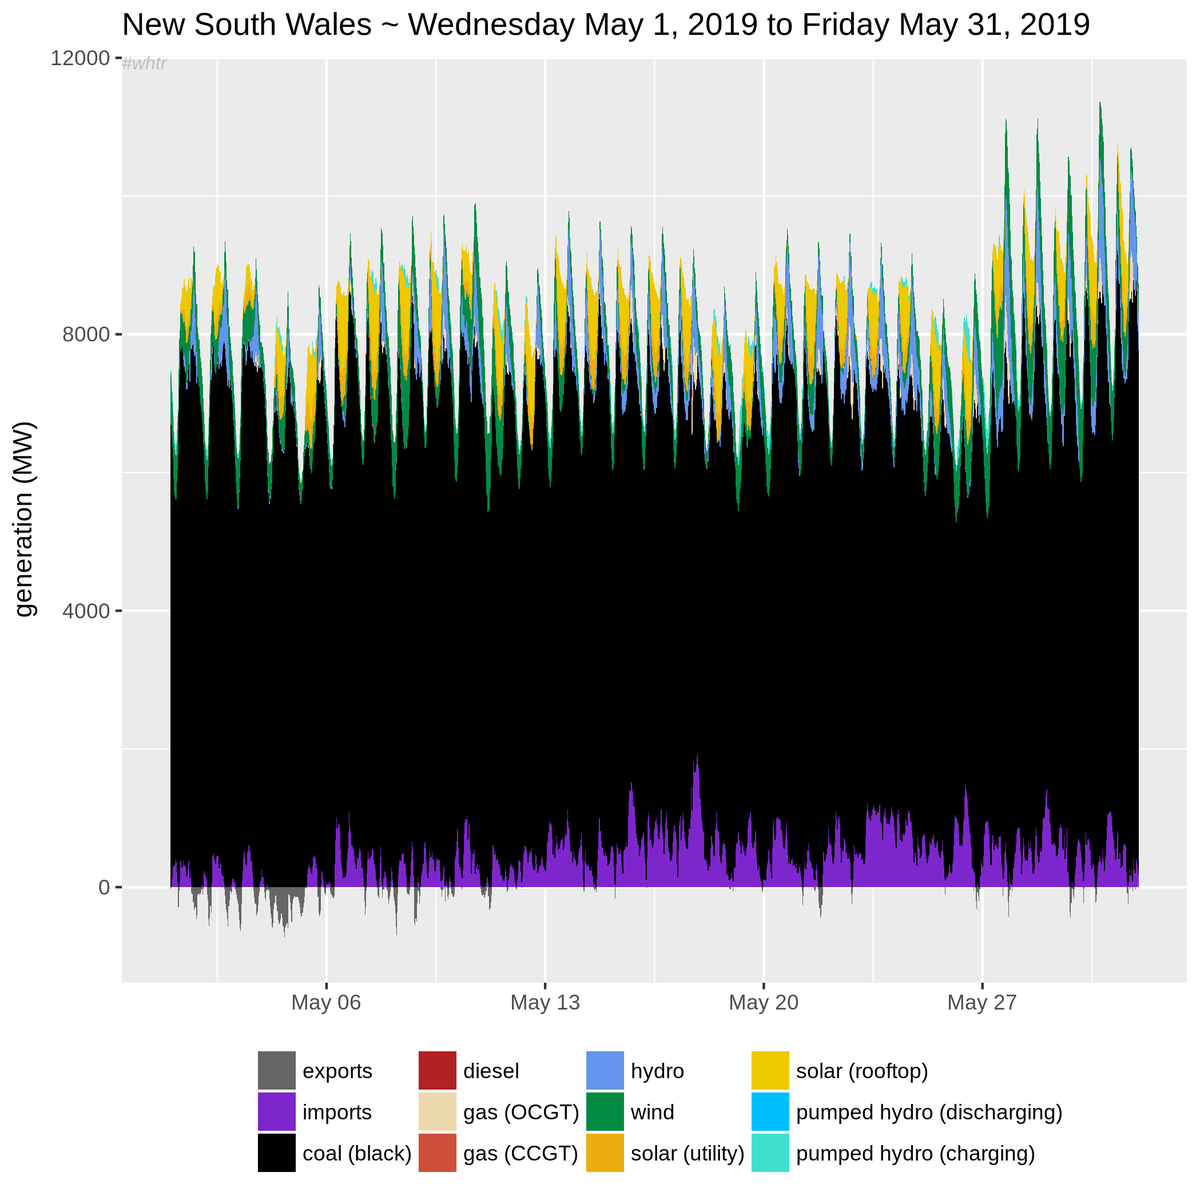
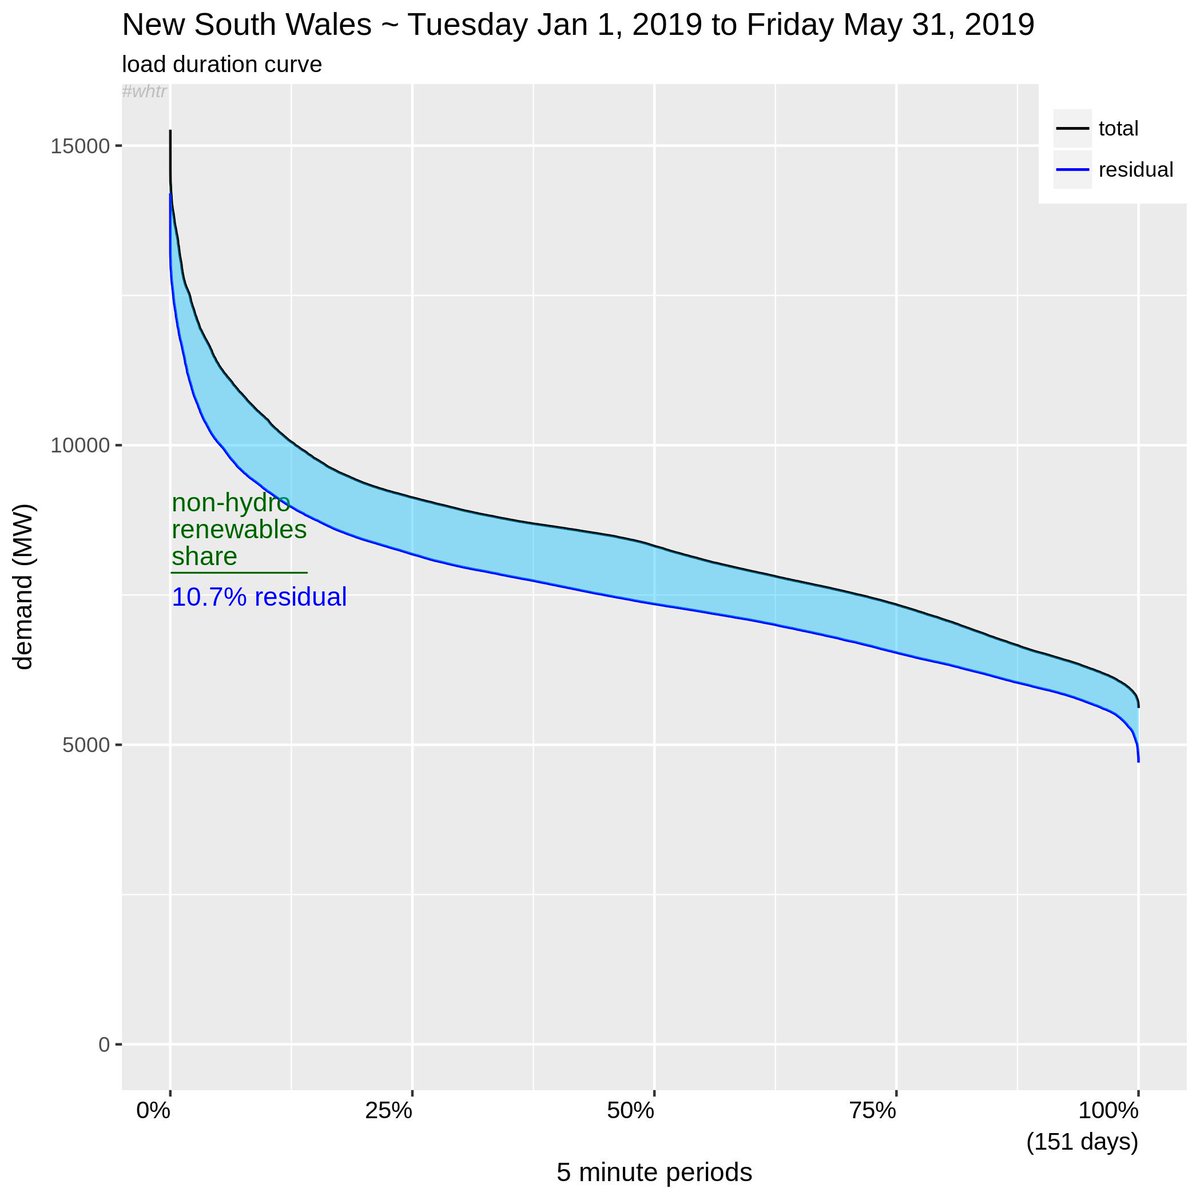
Making use of the excellent data tools at @OpenNem (that @simonahac is involved with) opennem.org.au/#/region/sa/en… & taking the in-state total demand👇 (so leaving aside exports), we reorder this data from highest to lowest.
also… @Banshee2030 & @GlenneDrover 1/×
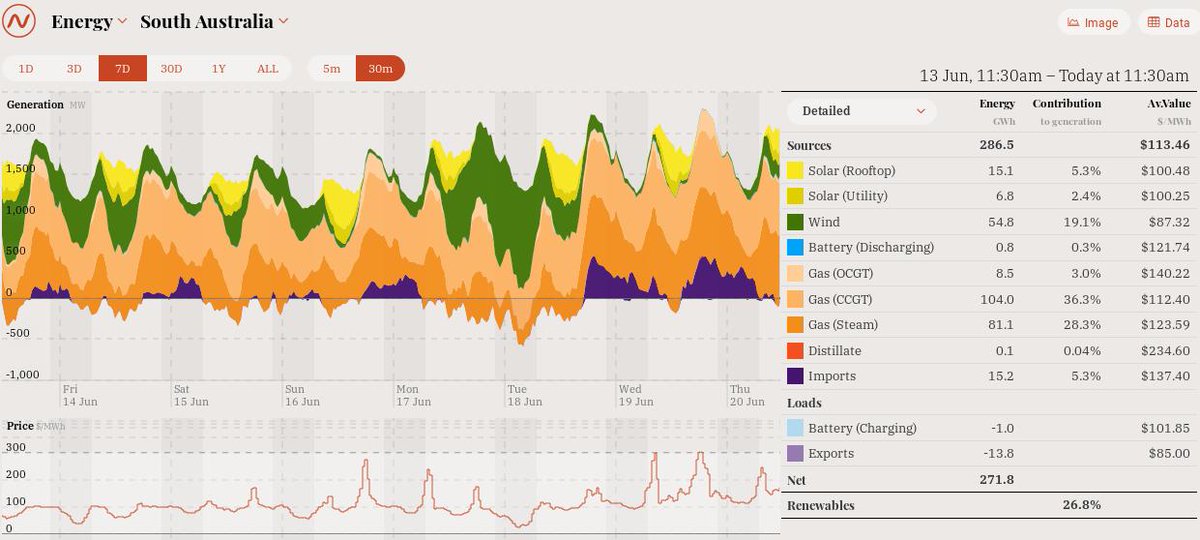
It's a way of "de-noise-ing" the signal, and straight away you can see useful things. Like ~10% of the time, demand peaks above 2GW.
It's a cumulative distribution curve, rotated 90° anti-clockwise. 2/×
Note that there isn't a one-to-one relationship between black & blue lines on the horizontal axis. 3/×
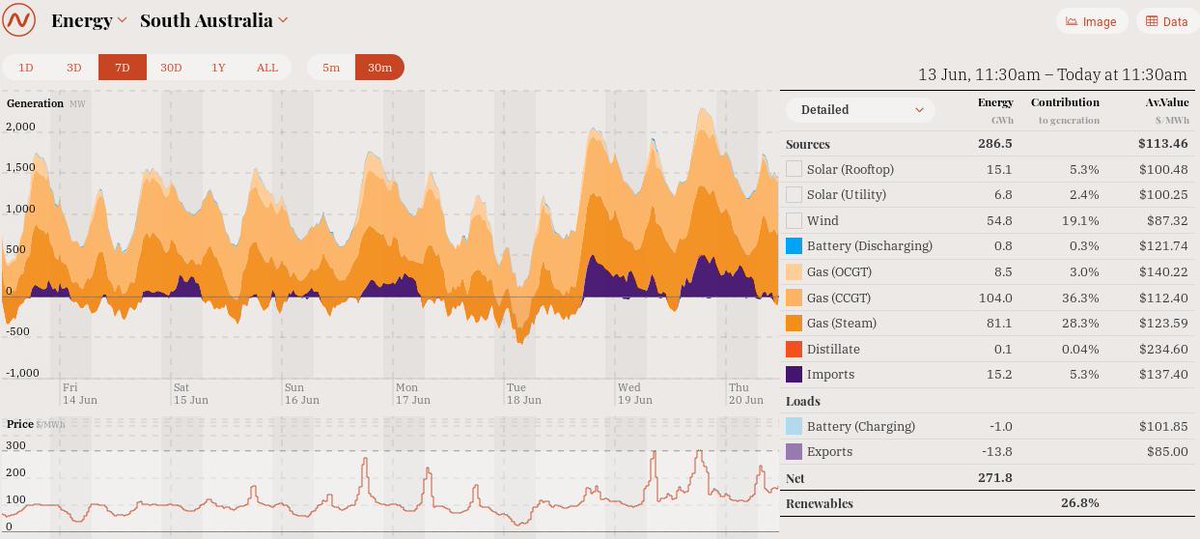
Clearly once that blue line goes negative, this is being exported into Victoria. 5/×
And the discussion that follows ain't half bad either. 6/×
Since that fateful System Black back in 2016, it has been a requirement to make sure a minimum level of gas plants are online 24/7. Logically, even when exports are non-zero, this is local use. 8/×

