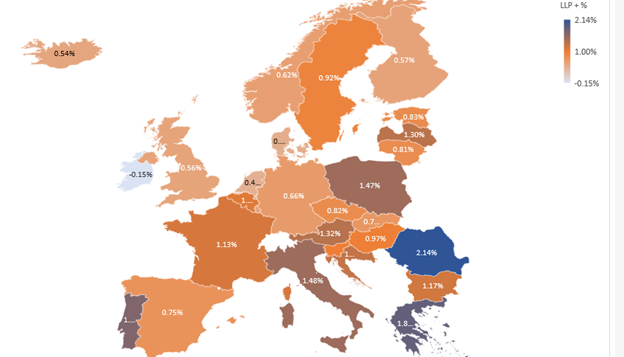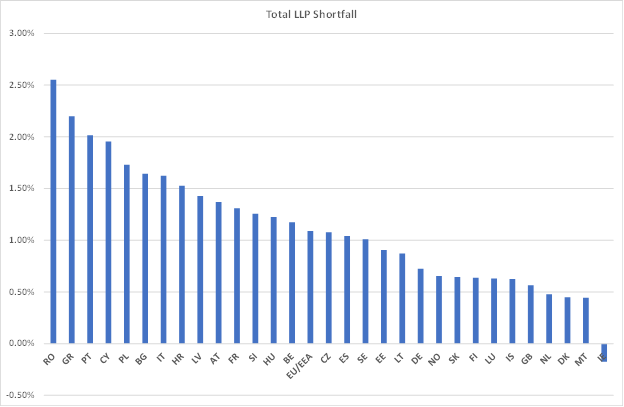
European Banks still need to book 220bn€ in loan losses for the Covid crisis.
(Disclaimer: this is just my estimate, I could be totally wrong, read what follows at your own risk.)
How do I get to that number? A thread.
(Disclaimer: this is just my estimate, I could be totally wrong, read what follows at your own risk.)
How do I get to that number? A thread.
A key reminder: banks book loans in 3 Stages. S1 is when all is good, S2 is when things start to deteriorate and S3 is when a loan is impaired (or NPL). Starting from this, when we try to understand what’s going on with Covid in banks’ book, we face three main problems:
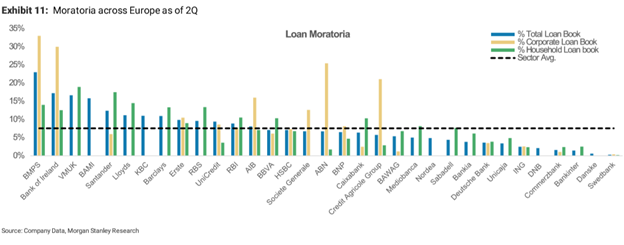
Problem 1: there is a massive use of payment holidays, which means we don’t really know if a company is in default. Here’s a recent chart from MS on the extent of the payment holidays issue. 
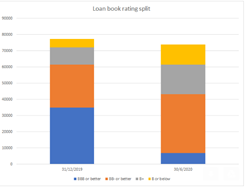
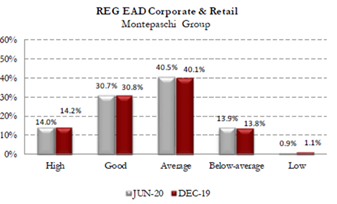
Problem 2: banks use statistical models to calculate loan losses and to estimate when a loan is in Stage 2… and those models are totally inconsistent with each other. Just compare the changes in ratings at Bank of Ireland and Monte Paschi. I'm sure you know who you trust more. 

Problem 3: there are huge amounts of state guarantees and this obviously impacts losses.
How do we get around this? Using the only consistent data set available, the EBA data set. In this case, let us work with the quarterly risk dashboard data, a treasure trove if you know how to use it.
Compared to Dec 19, in June 2020 banks had +0.28% of their loan books in additional provisions. The main drivers of those provisions changes are illustrated below. 
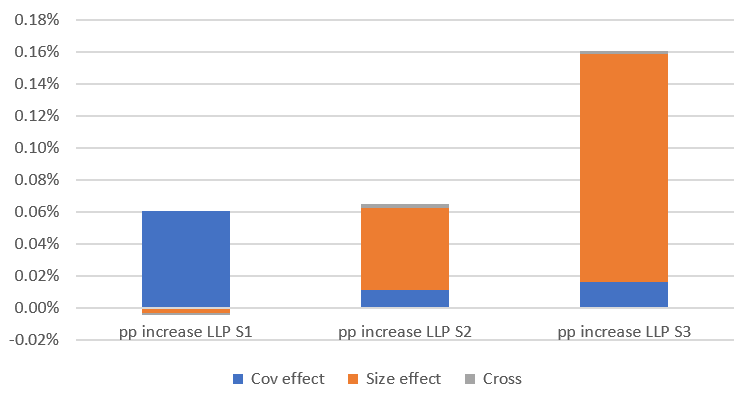
By order of importance we can see that: new Stage 3 loans (“size effect”) contribute +0.14%, increase of coverage on Stage 1 loans (“cov effect”) +0.06%, new Stage 2 loans +0.05% and increase of coverage on Stage 3 loans +0.02%.
Because of the moratoriums, I don’t think “new Stage 3 loans” is a meaningful metric to understand what will happen next. Still, here’s a map of what happened in H1 2020. 
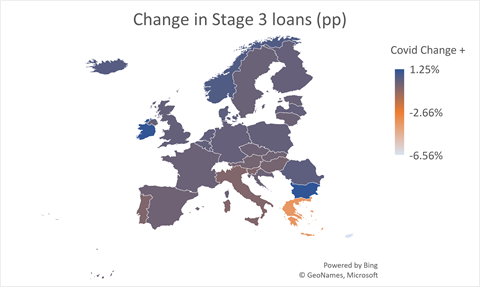
It’s pretty straightforward to see what happened: in the periphery (Cyprus, Greece, Portugal, etc.) there were NPL sales driving the numbers down, while the rest of Europe saw an increase of approx. 0.4 pp in NPLs.
The second main driver is the increase of provisions on Stage 1 loans – that is really a key metric because Stage 1 provisions are just the expected loss over 1 year. So they tell you how probabilities of default have evolved during the Covid crisis.
Using EBA data, I tried to understand the drivers for Stage 1 coverage changes. The explaining variables are the book structure (%SME loans, %mortgages, %consumer loans, share of each NACE sector, previous share of S1 and S2 loans, etc.) as well as the severity of the lockdown.
Because we have many variables and possible outliers with smaller countries, I use i) classical noise filtering / shrinkage techniques to find the relevant variables and ii) robust regression tools to avoid outliers’ influence.
I get the following model for increase of Stage 1 coverage.
(On those scatter plots, the x-axis is the model forecast, the y-axis is the actual EBA data.)
(On those scatter plots, the x-axis is the model forecast, the y-axis is the actual EBA data.)
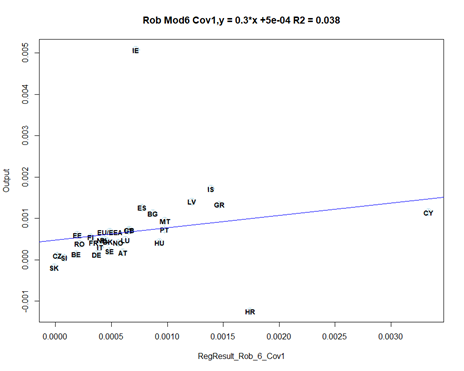
Hello, Ireland? Is everything okay, hun? Seriously, if everybody provisioned like the Irish, all EU banks would be bust 😊 (this is a JOKE.)(But still impressive.) Croatia, not so good, though. And I hear tourism is big there…
Also interesting are the relevant variables selected by the model: share of consumer loans, accommodation/food, construction, leisure, manufacturing… looks like a copy and paste of the @ecb FSR that discussed fragile sectors and Covid. So it's consistent.
The second main driver of provisions is the increase of Stage 2 loans – also key because it tells you how many businesses are now really struggling, even if they are not booked as Stage 3 (or NPLs) because of the moratoriums.
I am using the same optimized regression procedure described above. Here’s what I get, in terms of modelling the increase in Stage 2 loans in each country. 
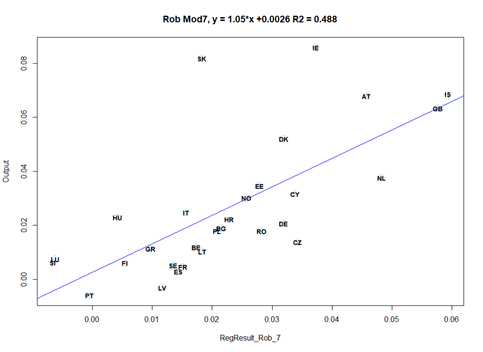
(Btw you can see the added value of robust regressions on that chart: there are outliers, but the regression looks really solid outside the outliers.)
What does this tell us? First, Ireland (again!) and Slovakia were SUPER conservative.
What does this tell us? First, Ireland (again!) and Slovakia were SUPER conservative.
Second, no one looks absurdly non conservative (Czech Republic maybe.)
But something is really intriguing. The model says Portugal should have (and had) very few new Stage 2 loans. That sounds totally nuts considering all that we know about the country and its banks.
But something is really intriguing. The model says Portugal should have (and had) very few new Stage 2 loans. That sounds totally nuts considering all that we know about the country and its banks.
Bear with me, because this is crucial.
To understand what is going on, let’s look at the coefficients of the regression. They are actually very intuitive (and statistically significant): CRE, Leisure, harsh lockdown, previous share of S2 loans, etc., will get you in trouble. 
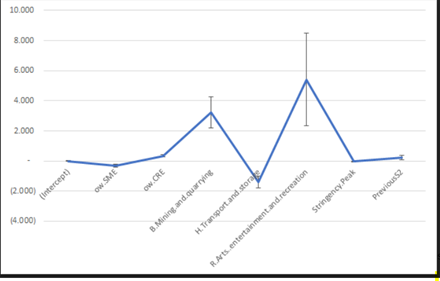
On the positive side, transport/logistic exposures are actually helping, probably because most exposures are actually on road transport and logistics, rather than on airline or shipping (except for some banks ofc, we know who you are!)
But what about SMEs? It's hard to see on the chart, but the model says that the higher your SME exposure, the lower the risk. That doesn’t make ANY sense at all.
I know, SME have benefited from HUGE support (moratorium, guarantees, furlough, etc.), but I still don’t buy it, if only because big companies also received help. And because SME lending is simply MUCH riskier. So what’s going on?
Talking to banks, I think what we’re seeing is this:
Moratorium and guarantees have eliminated cash-flow risk. Apart from that, banks are totally in the dark. SMEs file financials only once a year and banks simply don’t know how SMEs are currently doing.
Moratorium and guarantees have eliminated cash-flow risk. Apart from that, banks are totally in the dark. SMEs file financials only once a year and banks simply don’t know how SMEs are currently doing.
So SME loans do not lead to an increase in Stage 2 loans… simply because banks are in the dark and have not updated their models!
But, of course, this won’t continue forever. At some points SMEs will file accounts and payment holidays will lapse.
But, of course, this won’t continue forever. At some points SMEs will file accounts and payment holidays will lapse.
I used a simple trick to try to assess what will happen: let’s use that regression, but with a 0% coefficient for SMEs. That’s not hugely conservative, one could argue SME are riskier. But let’s give some credit to furlough scheme, tax relief, guaranteed lending, stimulus, etc.
That’s a bit like saying all countries will behave like countries with almost no SME lending (i.e. UK or Denmark).
Re-running the model gives us the new Stage 2 loans for each country – and new Stage 2 provisions.
What then? We need to know the share that will eventually go into Stage 3, i.e. NPLs. That’s a hugely tricky estimate to make.
What then? We need to know the share that will eventually go into Stage 3, i.e. NPLs. That’s a hugely tricky estimate to make.
Talking to banks they mention 20%-40% share – quite a wide margin.
One can also look at the current stock: what’s the share of S2 loans among S2+S3 loans? It’s an interesting metric, but we need to exclude countries where NPL have been there for ages, (stock vs. flow problem.)
One can also look at the current stock: what’s the share of S2 loans among S2+S3 loans? It’s an interesting metric, but we need to exclude countries where NPL have been there for ages, (stock vs. flow problem.)
The average looks like 25%-ish, consistent with what banks say. We should take into account the severity of this crisis, but also the existence of guarantees on a share of the book. That’s why I’m using a lower (20%) S2->S3 migration rate. Ofc sensitivities are available. 
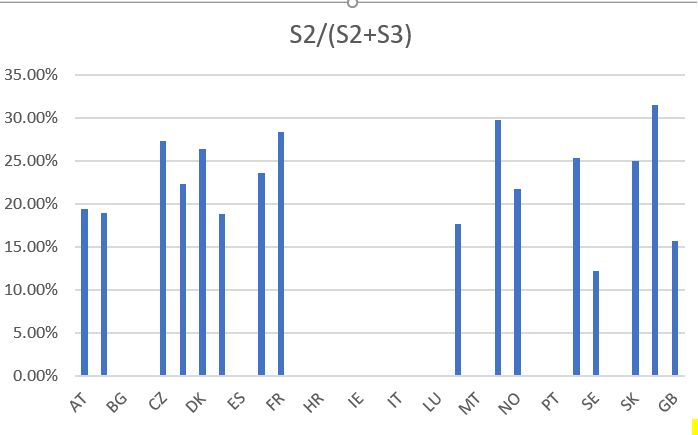
We now have extra S1 coverage, new S2 & S3 loans.
To get to final provisions, we just need to assess the changes in S3 coverage using the same approach as S1 coverage. That’s the chart below – the outlier is now Denmark and the periphery clearly a bit light on coverage.
To get to final provisions, we just need to assess the changes in S3 coverage using the same approach as S1 coverage. That’s the chart below – the outlier is now Denmark and the periphery clearly a bit light on coverage.
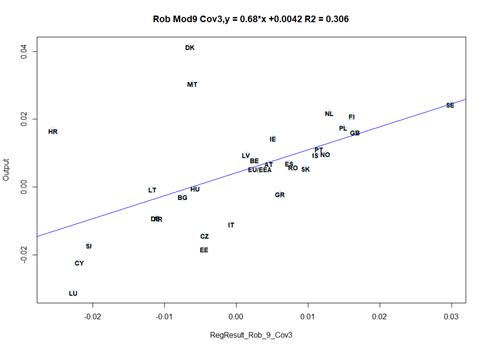
The bottom line here is that 220bn might look like a huge number, but it’s actually quite reasonable, slightly less than 1.1% of loans.
Careful though, because, as always in EU banking, the outliers are what matters… & clearly some countries will struggle.
Careful though, because, as always in EU banking, the outliers are what matters… & clearly some countries will struggle.
Bottom line #2: Ireland has been traumatized by the EZ crisis, and now they provision like crazy 😊. Seriously, have a beer and chill.
• • •
Missing some Tweet in this thread? You can try to
force a refresh
