21 October #BetweenTheLinesDotVote Analysis

Analysis Works! Check This Out!!

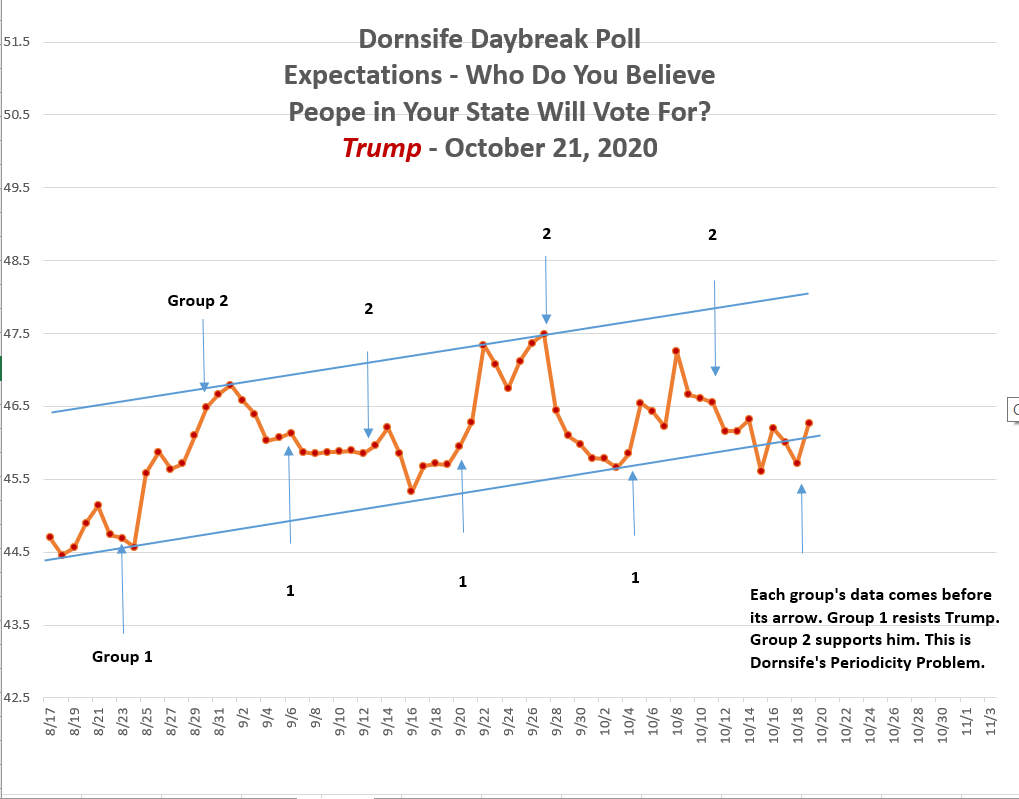
I started this analysis a few days ago, and knew I'd gotten my hands on something, but wasn't quite sure what. Now I know, and show in the chart below. They call this their Periodicity Problem.
2) It takes mental discipline to read this chart. I call it the Go On 3 problem. Do we go the instant we hear 3? Or, do we wait until the word "three" is completed? Do you count from the start of something, or from its end? Believe it or not, its actually an important problem.
3) To read this chart, you need to understand some fundamental information. 1, 2, 3, 4, 5, 6, 7! That's one week. Seven days. And, it marks roughly one half of Dornsife's respondents. I call them Group 1. And I denote their thoughts at the END of the week.
4) I do the same, obviously, for Group 2, the 2nd half of the Dornsife sample. On this chart, there are 9 weeks' data. In EVERY SINGLE INSTANCE Group 1 resists Trump, Group 2 supports him. Look and see. It's as predictable as if it were a law.
5) A review is needed. Back in 2016, Dornsife cycled through its entire sample every single week. Thus, there was NO Periodicity Problem! What does this mean? It means they have utterly failed the RANDOMIZATION requirement for their poll. It is NOT RANDOMIZED.

THIS IS HUGE.
6) I wont bore you, I promise. Random sampling is simply the sine qua non, the ultimate mandate of scientific analysis. If you allow your sample to be biased, you have failed. I know whereof I speak. My own BetweenTheLines.Vote sampe is still NOT randomized.
7) I keep intending to present my data, but as I assess it, I can't get over my fear of a NON-RANDOMIZED sample. I fight this with all I am. And, that makes me hold back. I fear my sample is BIASED, not RANDOMIZED. A biased sample is simply of little value.
8) I don't know - I think they do... - if the Dornsife people follow my analysis. If they do, they MUST do something about this problem, far more than they have done so far.

Let's come at this another way.
9) The data is NOT supposed to be predictable. If it is predictable, then why do we need it? We make a simple prediction. We're right. All done. The sun will rise tomorrow, just like it did today. This is not a matter of question. No polling will help us understand this.
10) Let's go deeper now. To my eye, as you know, Dornsife was the best out there. They have surrendered their right to title. They did it to themselves, but my theory is that they did it in mere compliance with their finance source, the LA Times. Biden will win. Period.
11) This is NOT science. It is the abrogation, the treason to science. No outside analyst such as myself should be able to predict outcomes which therefore FAIL to predict America's will. They have surrendered the torch of their mission. Shame on them. Shame on you, Dornsife.
12) Can we therefore predict a Trump victory? I have. But my qualifier is that much as I tried, I NEVER found a source of data - or built one - adequate to my own scientific standards. So, my call reflects my desires NOT as supported by data. I hate that more than words can say.
13) But there may be a way for me to relax a little. If the best in the business HAS TO falsify their own data, then maybe that tells us just how powerful the MAGA Movement really is. If they showed the true data, Trump's easy victory would be obvious, right there.
14) Believe it or not, this is this morning's short thread. I have another analysis to pick up on, first posted yesterday, here:

15) If I can get that second part completed today, then, I plan on a full chart update tomorrow. I suspect we're seeing the implosion of Biden's run over his criminal and treasonous actions, now coming out. But, no need to jump the gun. We'll see, soon enough.
Thread ends at #15.

• • •

Missing some Tweet in this thread? You can try to force a refresh
 

Keep Current with Pasquale "Pat" Scopelliti

Pasquale

Stay in touch and get notified when new unrolls are available from this author!

Read all threads

This Thread may be Removed Anytime!

PDF

Twitter may remove this content at anytime! Save it as PDF for later use!

Try unrolling a thread yourself!

how to unroll video
  1. Follow @ThreadReaderApp to mention us!

  2. From a Twitter thread mention us with a keyword "unroll"
@threadreaderapp unroll

Practice here first or read more on our help page!

More from @ThyConsigliori

21 Oct
21 October 2020 #MAGAanalysis

#TheInvisibleWar #WarWithChina #BidenCrimeFamily #CoveringTumpsSix Part 2

Yesterday's work seems to have garnered a fair amount of interest. Just using Twitter's numbers, it did well, relative to my typical reach. I am honored and grateful.
2) Yet, as I wrote it, and in the questions that thoughtful readers gave me after, I realized I'd left some important gaps uncovered. My hope, today, is to fill those gaps. I hope I can get this done in just today's thread, so 2 and done!
3) Let's begin with a little clarification of credit. First, I tagged and thanked @tamaraleighllc, but failed to say why! The reason is, she both introduced me to @Johnheretohelp and forwarded the thread he gave us about China. Thanks again, Gal. You're the best!
Read 46 tweets
20 Oct
20 October 2020 #MAGAanalysis

#TheInvisibleWar #WarWithChina #BidenCrimeFamily #CoveringTumpsSix

Following all those hashtags, we begin tonight with tremendous honor to @TuckerCarlson. He is, bar none, the most courageous journalist in America today. What a hero!
2) Before we dive in, honor goes out to two others. First, @tamaraleighllc who just got her account back!!! And 2nd to @Johnheretohelp. John ALWAYS calls out the hard truth you hear from so few others. And man, does he get the China issue. His work inspires tonight's analysis.
3) We've done this before, but it's time for a review of our rogues' gallery of POTUSes who sold our American Destiny to China. I'm going to go slowly on this. You'd think we'd begin with Nixon, and maybe we should, yet, I say no. My reason follows...
Read 53 tweets
19 Oct
Context: Anthony was riding the scooter like he was just walking on his feet. So, I gave him the bike and started working on my scootering skills - read that as lack of skills!
So here’s my question: how many of you know how to learn with your body, as opposed to your brain? It’s like this whole new universe to me! Example, leaning back changes stupas opposed to leaning forward. Who knows these things?
Anthony has 5 nothing but nets, and I haven’t hit a single basket yet, if any kind...
Read 4 tweets
18 Oct
18 October 2020 #AtThyConsiglioriBizAnalysis

FedEx - Part 2 of 10, As Inspired By Dave Schneider

I have a friend. He is the Number 1 Logistician in the world. Logistician? It is one who masters all the arts of logistics. You can't imagine how many.

wearethepractitioners.com/index.php
2) Dave's second company who's stock he wants me to analyze is FedEx. When he told me that, my first response was an idiotic yawn. I foolishly thought, 'how different from UPS is the stock motion going to be?' I thought they'd be almost identical. Ha! It's fun to be so wrong.
3) Before I start showing you charts, let's talk about method. I'm essentially the exact opposite of a day trader or a TV talking head stock analyst. You have to let me go off for a moment. When I hear their daily analysis, the stock market did this today, for that reason...
Read 26 tweets
17 Oct
17 October 2020 #AtThyConsiglioriBizAnalysis

Logistics. Who Doesn't Love Logistics? UPS - 1 of 10.

I have an amazing friend. He's the greatest logistician in the world. His name is David Schneider. Check him out!

wearethepractitioners.com/index.php
2) David has given me 10 logistics companies to analyze. UPS is the first and here we go. My standard method will be this. We take the long term max numbers, then the 5 year numbers, then this year. First the raw chart. Second my own lines.
3) I don't know if I'll always have to do this. But the time frame for each chart matters. Greatly. Our first chart, no lines drawn, shows about 20 years worth of UPS stock data. Obviously, it's a good stock!
Read 31 tweets
17 Oct
17 October 2020 #BetweenTheLinesDotVote Analysis

Some Damned Data You Can Believe In!

Wanna know what keeps me up at night? Bad data does. It pisses me off. It gives me nightmares. No kidding. You get the idea that I hate bad data, right? So soothe your eyes with me here.
2) Now that is true data. Feast your eyes upon it. Take it in. You want truth? I do! This is truth. It's the real deal. It actually happened and there ain't nobody trying to mess with this image. No propaganda. No Psyop. Just raw, honest, real truth. Go slowly with me.
3) Note the time frame. We see 4 10-year points on our X axis across the bottom: 1986, 1996, 2006, 2016. We can guess we go back to an unmarked 1980, and forward to the present, so 40 years of real, honest data.
Read 30 tweets

Did Thread Reader help you today?

Support us! We are indie developers!


This site is made by just two indie developers on a laptop doing marketing, support and development! Read more about the story.

Become a Premium Member ($3/month or $30/year) and get exclusive features!

Become Premium

Too expensive? Make a small donation by buying us coffee ($5) or help with server cost ($10)

Donate via Paypal Become our Patreon

Thank you for your support!

Follow Us on Twitter!