
monitor below chart closely.
$NQ just re-tested the lower support level
$NQ low = 11,598
they can't allow to plunge below 11,600 level.
otherwise, tomorrow bloodbath.
see below Support & Resistance levels
super accurate😉
stop-run levels on both sides: bulls & bears👇
$NQ just re-tested the lower support level
$NQ low = 11,598
they can't allow to plunge below 11,600 level.
otherwise, tomorrow bloodbath.
see below Support & Resistance levels
super accurate😉
stop-run levels on both sides: bulls & bears👇
https://twitter.com/kerberos007/status/1318918295714750464
$NQ support & strong resistance levels
4-hr chart since Aug
$NQ above 11,600 = strong support (late Aug)
once breaking down below 11,600 (in Sep), then
it became strong resistance
then,
once it breaking above 11,600 (in Oct), it became strong support
super accurate TA? 😉
4-hr chart since Aug
$NQ above 11,600 = strong support (late Aug)
once breaking down below 11,600 (in Sep), then
it became strong resistance
then,
once it breaking above 11,600 (in Oct), it became strong support
super accurate TA? 😉

$NDX (not $NQ)
$NQ futures has ON real volume
$NDX is an index; there is no real volume
$NDX volume is approximated by aggregating volumes from individual component stock using weighted avg
not 100% accurate, but close for our purposes.
below: use your imaginations
$NQ futures has ON real volume
$NDX is an index; there is no real volume
$NDX volume is approximated by aggregating volumes from individual component stock using weighted avg
not 100% accurate, but close for our purposes.
below: use your imaginations

$GC = $Gold futures.
Magnet = 1900
liquidity hunting everywhere.
a chart is worth a million words. 😉
no comment needed.
👇👇👇
Magnet = 1900
liquidity hunting everywhere.
a chart is worth a million words. 😉
no comment needed.
👇👇👇

$GC: Gold futures
OI and Max Pain.
Oct 30 expiry: next Friday
Max Pain = 1900
OI speaks volumes
OI and Max Pain.
Oct 30 expiry: next Friday
Max Pain = 1900
OI speaks volumes

FWIW:
$NQ: E-mini NDX-100
Oct 30 expiry: next Friday
Max Pain: 11,700
#NQ is too volatile and OI is very thin;
mostly, short-term speculators.
so, Max Pain changes daily, and is not reliable.
$NQ: E-mini NDX-100
Oct 30 expiry: next Friday
Max Pain: 11,700
#NQ is too volatile and OI is very thin;
mostly, short-term speculators.
so, Max Pain changes daily, and is not reliable.
#S&P500 sector PCR analysis - leading
$SPY, $QQQ &
$XLK, $XLY, etc
2.5 yr data
1 sum calls & puts for all component stocks in the index/sector
2 cal aggregate PCR for the index/sector
3 cal 2.5 yr correlation b/w sector price & sector PCR
4 ranking in the next post
$SPY, $QQQ &
$XLK, $XLY, etc
2.5 yr data
1 sum calls & puts for all component stocks in the index/sector
2 cal aggregate PCR for the index/sector
3 cal 2.5 yr correlation b/w sector price & sector PCR
4 ranking in the next post
Aggregate component stock PCR corr ranking
aggr PCR & QQQ/SPY price corr (2.5 yr)
1 QQQ-103 stks=-62%
2 SPY-502 stks=-60%
3 $MTUM stks=-59%
4 $XLK=-57%
if just include the top 10 stks in QQQ PCR,
the correl b/w PCR & QQQ price is even higher(-ve)
QQQ stk PCR= leading ind😉
aggr PCR & QQQ/SPY price corr (2.5 yr)
1 QQQ-103 stks=-62%
2 SPY-502 stks=-60%
3 $MTUM stks=-59%
4 $XLK=-57%
if just include the top 10 stks in QQQ PCR,
the correl b/w PCR & QQQ price is even higher(-ve)
QQQ stk PCR= leading ind😉
In other words
the OTM call strategy works
the higher the QQQ-103 stock call buying, the lower the QQQ-103 PCR, pushing QQQ price higher
but, when at extremes, it became the best Contrarian ind ever 😉
STFR FOMO/Euphoria/greed extreme🦃
BTFD fear/capitulation extreme🍻
the OTM call strategy works
the higher the QQQ-103 stock call buying, the lower the QQQ-103 PCR, pushing QQQ price higher
but, when at extremes, it became the best Contrarian ind ever 😉
STFR FOMO/Euphoria/greed extreme🦃
BTFD fear/capitulation extreme🍻
$SPY OI, OI PCR and Max Pain for all the Options Expiry series.
as of Friday, 2020-10-23
with closing price for reference.
up to Jan-2023 leap options
as of Friday, 2020-10-23
with closing price for reference.
up to Jan-2023 leap options

$QQQ OI, OI PCR and Max Pain for all the Options Expiry series.
as of Friday, 2020-10-23
with closing price for reference.
up to Jan-2023 leap options
as of Friday, 2020-10-23
with closing price for reference.
up to Jan-2023 leap options

$SPX OI, OI PCR and Max Pain for all the Options Expiry series.
as of Friday, 2020-10-23
with closing price for reference.
super bearish in SPX monthly options.
hint: hedging.
as of Friday, 2020-10-23
with closing price for reference.
super bearish in SPX monthly options.
hint: hedging.

$NDX OI, OI PCR and Max Pain for all the Options Expiry series.
as of Friday, 2020-10-23
with closing price for reference.
as of Friday, 2020-10-23
with closing price for reference.

$GLD ETF OI, OI PCR and Max Pain for all the Options Expiry series.
as of Friday, 2020-10-23
pinned to 178.5 to 180 for next few OpEx.
high OI volume OpEx series have massive call OIs (low PCR)
as of Friday, 2020-10-23
pinned to 178.5 to 180 for next few OpEx.
high OI volume OpEx series have massive call OIs (low PCR)

$HYG ETF OI, OI PCR and Max Pain for all the Options Expiry series.
as of Friday, 2020-10-23
massive put OIs (high PCR) across the board.
pinned to 84.5 to 85 for next few OpEx.
as of Friday, 2020-10-23
massive put OIs (high PCR) across the board.
pinned to 84.5 to 85 for next few OpEx.

speaking of HYG
IEF:HYG ratio (credit) & $VIX correlation
extremely HIGH in times of stress, fear, VIX spike
especially just before Feb & Mar pandemic
in both times $VIX spiked before credit spread
$VIX always knows; as good as $PCR, $JPY & $Gold
this time is different?😉
IEF:HYG ratio (credit) & $VIX correlation
extremely HIGH in times of stress, fear, VIX spike
especially just before Feb & Mar pandemic
in both times $VIX spiked before credit spread
$VIX always knows; as good as $PCR, $JPY & $Gold
this time is different?😉

Quiz time😉 P-indicator
another "super contrarian" leading indicator: bottom ind
super complacent, just like $IEF / $HYG credit ratio
see the bottom mystery P-ind
correlation with VIX is extremely high
super accurate contrarian indicator at extremes.
😉🧐 BTFD $VIX strategy
another "super contrarian" leading indicator: bottom ind
super complacent, just like $IEF / $HYG credit ratio
see the bottom mystery P-ind
correlation with VIX is extremely high
super accurate contrarian indicator at extremes.
😉🧐 BTFD $VIX strategy

by popular demand
total Equity Call/Put Ratio 5-day SMA (P/C ratio reversed)
from 16 exchanges
BTFD when dark blue line (CPR) dip below Capitulation Zone then cross above it
Lottery tickets accumulation when CPR surge above FOMO with Jaws & trend-line break👌
today = FOMO😉
total Equity Call/Put Ratio 5-day SMA (P/C ratio reversed)
from 16 exchanges
BTFD when dark blue line (CPR) dip below Capitulation Zone then cross above it
Lottery tickets accumulation when CPR surge above FOMO with Jaws & trend-line break👌
today = FOMO😉

Oct 26:
VIX term structure - Backwardation
#VIX9D = 35.91 (+11.62 pts)🔥
$VIX = 32.46 (+4.91 pts)🔥
$VVIX = 133.08 (+14.14 pts)🔥
Backwardation - the entire term structure inverted = Fear
from Contango just Friday = Complacent.
volatility always came fast & furious🍻
VIX term structure - Backwardation
#VIX9D = 35.91 (+11.62 pts)🔥
$VIX = 32.46 (+4.91 pts)🔥
$VVIX = 133.08 (+14.14 pts)🔥
Backwardation - the entire term structure inverted = Fear
from Contango just Friday = Complacent.
volatility always came fast & furious🍻

Oct 26:
$VX futures term structure - Backwardation
Backwardation term structure across the board - Fear
left tails starting to price in quickly. 🔥
$VX futures term structure - Backwardation
Backwardation term structure across the board - Fear
left tails starting to price in quickly. 🔥

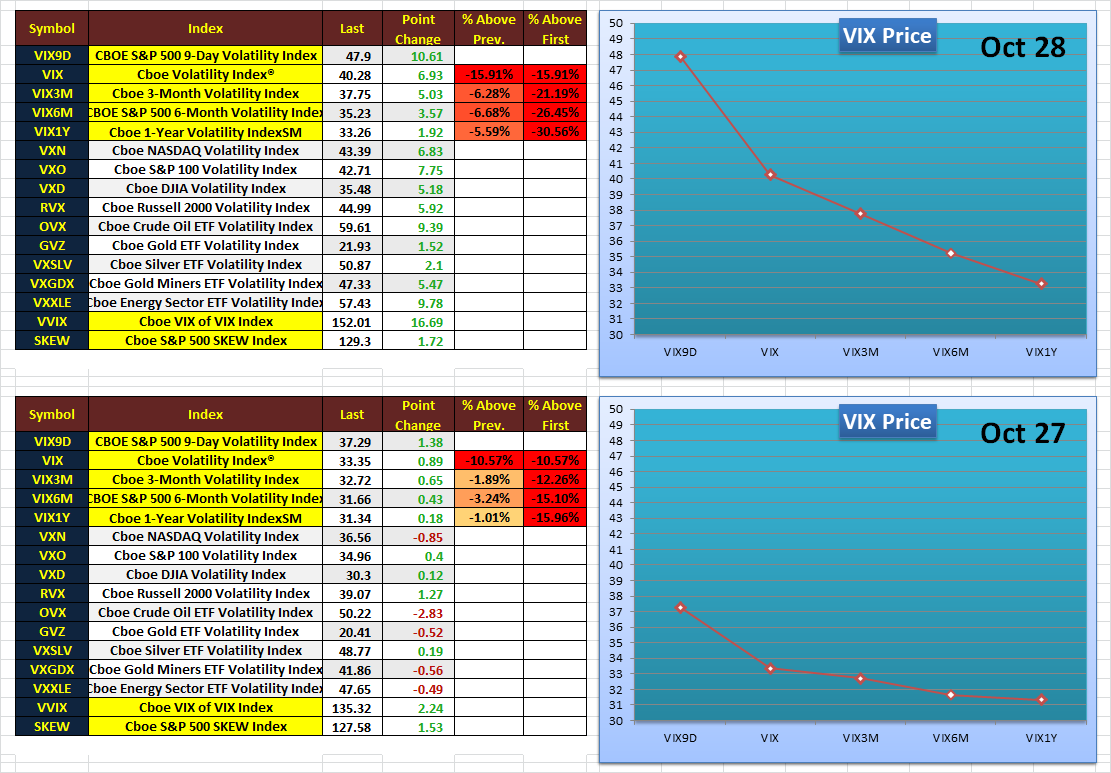
Oct 28:
$VIX term structure.
steep backwardation = extreme fear
the #MVGA hat:
#VIX9D = 47.9 🔥
$VIX = 40.28 🔥
$VVIX = 152.01 🔥
$SKEW = 129.3
vote to #MVGA
4 more years. 😉🍻
$VIX term structure.
steep backwardation = extreme fear
the #MVGA hat:
#VIX9D = 47.9 🔥
$VIX = 40.28 🔥
$VVIX = 152.01 🔥
$SKEW = 129.3
vote to #MVGA
4 more years. 😉🍻
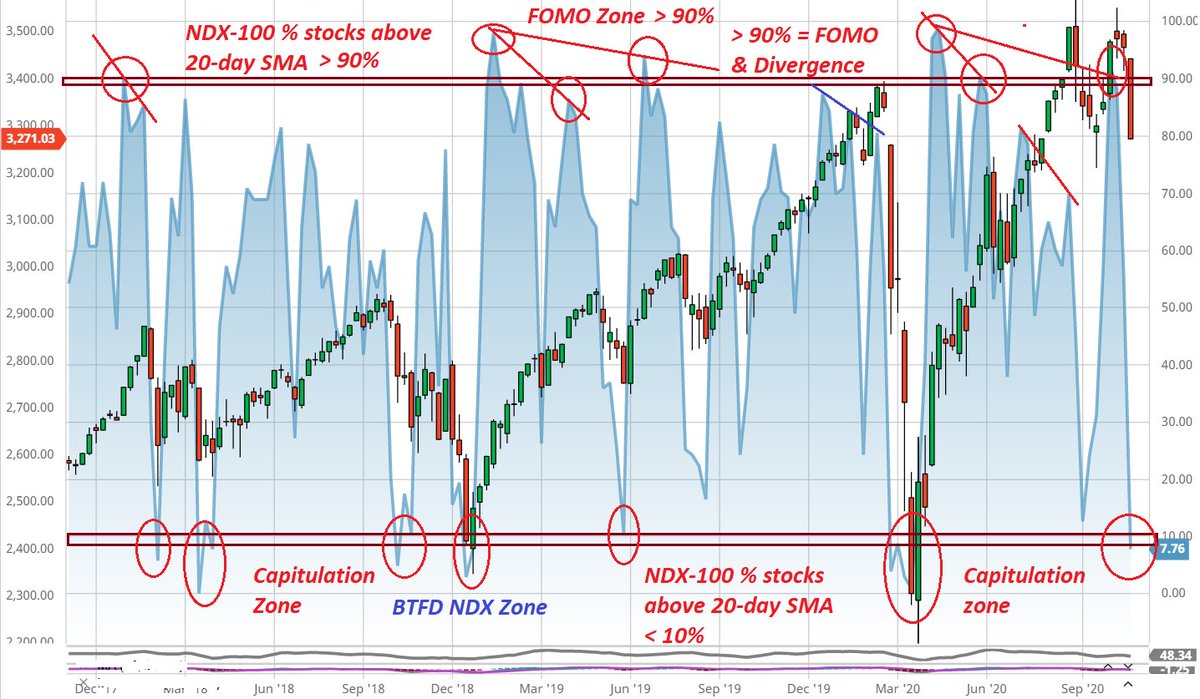
$NDX-100 breadth update:
$NDX % stocks above 90% = Euphoria/FOMO zone
$NDX % stocks below 10% = Capitulation Zone
Today = 7.76% (only 7 or 8 stocks above 20-day SMA)
First index = Capitulation
see March lows?
0% stocks above 20-day SMA = Maximum Pessimism 🔥
$NDX % stocks above 90% = Euphoria/FOMO zone
$NDX % stocks below 10% = Capitulation Zone
Today = 7.76% (only 7 or 8 stocks above 20-day SMA)
First index = Capitulation
see March lows?
0% stocks above 20-day SMA = Maximum Pessimism 🔥
Russell-2000 breadth ind
one of the better breadths
% stocks above 20-day SMA :
1 BTFD below Fear (<20%) & Capitulation (<10%)
2 STFR above Greed (>80%) & FOMO (>90%) with Jaws
Rut-2000 stocks better than NDX-100 stocks
study all the circles for short-term swing trading👍🧐
one of the better breadths
% stocks above 20-day SMA :
1 BTFD below Fear (<20%) & Capitulation (<10%)
2 STFR above Greed (>80%) & FOMO (>90%) with Jaws
Rut-2000 stocks better than NDX-100 stocks
study all the circles for short-term swing trading👍🧐

This indicator touched 11 on Friday (2 indicators; using red candles only)
and
Below 10 = Capitulation zone = pink circle
almost there
Rut-2000, NDX-100, SPX-500 stocks % above 20-day SMA were all rising significantly before the close on Friday
More room to go down.🧐 #MVGA
and
Below 10 = Capitulation zone = pink circle
almost there
Rut-2000, NDX-100, SPX-500 stocks % above 20-day SMA were all rising significantly before the close on Friday
More room to go down.🧐 #MVGA

Below Magic indicator is NOT for OB or OS (fear & greed) trading
It is designed for pinpointing swing highs & swing lows near tops/bottom (local maxima & minima) with high prob
1 long (calls) when red turning green
2 short when green turning red
for 401K,
only trade #1 BTFD🧐
It is designed for pinpointing swing highs & swing lows near tops/bottom (local maxima & minima) with high prob
1 long (calls) when red turning green
2 short when green turning red
for 401K,
only trade #1 BTFD🧐

Financial Stress Index ticks up to 0.1029 in the week ended Oct. 30 (0=normal)
see previous market corrections right after Financial Stress Index rising above 0 at rapid speed while $SPX $NDX were super bullish, complacent & FOMO
Feb 2018
Dec 2018
Sep 2019
Feb 2020
and Now?🧐
see previous market corrections right after Financial Stress Index rising above 0 at rapid speed while $SPX $NDX were super bullish, complacent & FOMO
Feb 2018
Dec 2018
Sep 2019
Feb 2020
and Now?🧐

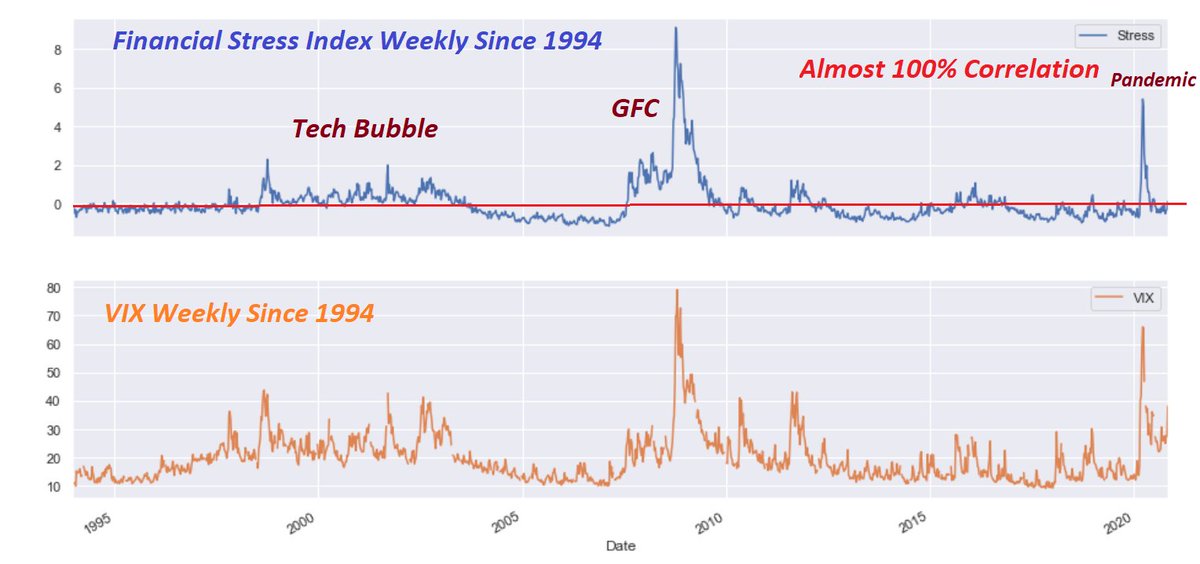
Shocking correlation between
1 St. Louis Fed Financial Stress Index and
2 VIX
Since 1994: amzing
To be exact: 26-year correlation = 85%
1 St. Louis Fed Financial Stress Index and
2 VIX
Since 1994: amzing
To be exact: 26-year correlation = 85%
Quiz 🧐
Super-duper leading indicator
1 want to predict #SPX levels & supply/demand zones?
2 below magic leading indicator would show you the way, along with other leading indis & clustering Algo
Jaws -> converge
hint: another great input to the Deep Learning Neurons
Quiz😉
Super-duper leading indicator
1 want to predict #SPX levels & supply/demand zones?
2 below magic leading indicator would show you the way, along with other leading indis & clustering Algo
Jaws -> converge
hint: another great input to the Deep Learning Neurons
Quiz😉

best "risk-off" correlation in last 20 yrs
FX risk-off indi: $AUDJPY
1 Jaws #1= 2000 AUDJPY dn, SPX up
2 Jaws #2= 2008 SPX dn, AUDJPY up
3 Jaws #3= 2015 AUDJPY dn, SPX up
4 Jaw3 #4= 2018 AUDJPY dn, SPX up
5 Jaws #5=2019 AUDJPY dn, SPX up
6 Jaws #6
Jaws->converge=dips=magnet😉
FX risk-off indi: $AUDJPY
1 Jaws #1= 2000 AUDJPY dn, SPX up
2 Jaws #2= 2008 SPX dn, AUDJPY up
3 Jaws #3= 2015 AUDJPY dn, SPX up
4 Jaw3 #4= 2018 AUDJPY dn, SPX up
5 Jaws #5=2019 AUDJPY dn, SPX up
6 Jaws #6
Jaws->converge=dips=magnet😉

quiz🧐
two more leading indicators that are highly correlated with $VIX
hint
not $VVIX
not $Gold
not #BitCoin
the Jaws would always converge eventually
providing future VIX upside & downside bias
note
Jaws in Jan/Feb 2018 -> #Volmageddon
Jaws in 2019 & Jan 2020 -> Pandemic
two more leading indicators that are highly correlated with $VIX
hint
not $VVIX
not $Gold
not #BitCoin
the Jaws would always converge eventually
providing future VIX upside & downside bias
note
Jaws in Jan/Feb 2018 -> #Volmageddon
Jaws in 2019 & Jan 2020 -> Pandemic

FWIW:
Max Pain and OI-PCR for the all available OpEx series:
VIX (VIX monthly
VIXW (VIX weekly)
VXX
UVXY
Max Pain and OI-PCR for the all available OpEx series:
VIX (VIX monthly
VIXW (VIX weekly)
VXX
UVXY

FWIW:
Max Pain and OI-PCR for the all available OpEx series:
SPX (SPX monthly)
SPXW (SPX weekly)
Max Pain and OI-PCR for the all available OpEx series:
SPX (SPX monthly)
SPXW (SPX weekly)

FWIW:
Max Pain and OI-PCR for the all available OpEx series:
SPY
Max Pain and OI-PCR for the all available OpEx series:
SPY


Amazing correlation
$VIX and $AAPL options Implied Volatility (IV-30day)
= 85%
$VIX and $AAPL historical volatility (HV-30day)
= 80%
similar behavior among all FANG+ stocks
excellent predicting power for future VIX price, if finding the "magic" combination of stocks👌😎😉
$VIX and $AAPL options Implied Volatility (IV-30day)
= 85%
$VIX and $AAPL historical volatility (HV-30day)
= 80%
similar behavior among all FANG+ stocks
excellent predicting power for future VIX price, if finding the "magic" combination of stocks👌😎😉

Amazing corr: displaying up to Feb
$VIX & $JPM options Implied Volatility (IV-30day)
= 98%
$VIX & $JPM historical volatility (HV-30day)
= 83%
similar behavior among all FANG+ stocks
excellent predicting power for future VIX price, if finding the "magic" combination of stocks
$VIX & $JPM options Implied Volatility (IV-30day)
= 98%
$VIX & $JPM historical volatility (HV-30day)
= 83%
similar behavior among all FANG+ stocks
excellent predicting power for future VIX price, if finding the "magic" combination of stocks

Rut-3000 % of Stocks > 20-d SMA
what BTFD? I missed this one before $PFE leak?🧐
this breadth ind dipped below 20% (fear zone) for 2 days in a row; I missed this one?🤦♂️
ES_F low=3225
ES_F high=3668
huge front-run🤣
conclusion
Rut-3000 breadth is better than Rut-2000 breadth😉
what BTFD? I missed this one before $PFE leak?🧐
this breadth ind dipped below 20% (fear zone) for 2 days in a row; I missed this one?🤦♂️
ES_F low=3225
ES_F high=3668
huge front-run🤣
conclusion
Rut-3000 breadth is better than Rut-2000 breadth😉

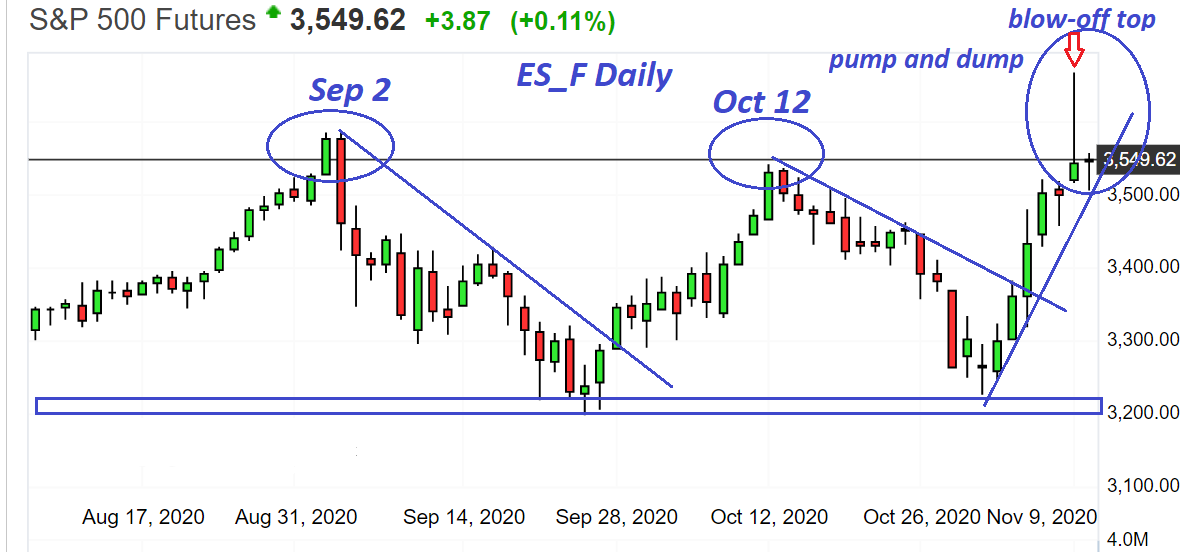
#ES_F super bullish++🦃 blow-off top
#ES_F daily chart.
$PFE front-run pump and dump.
where is $SEC & $DOJ ? 🤣🧐
hmmm they are part of the insider trading😉
#ES_F daily chart.
$PFE front-run pump and dump.
where is $SEC & $DOJ ? 🤣🧐
hmmm they are part of the insider trading😉
Spotting Outliers
long-term corr
$VIX & $NDAQ (IV-30d)
=97%
$VIX & $NDAQ (HV-30d)
=80%
Cal
7-day short-term correlation: $VIX & $NDAQ IV-30
when 7-day corr below 0%, outliers occurred.
see below chart, all 3 times predicted $VIX spike & $SPX corrections when 7-day corr < 0
long-term corr
$VIX & $NDAQ (IV-30d)
=97%
$VIX & $NDAQ (HV-30d)
=80%
Cal
7-day short-term correlation: $VIX & $NDAQ IV-30
when 7-day corr below 0%, outliers occurred.
see below chart, all 3 times predicted $VIX spike & $SPX corrections when 7-day corr < 0

OI wall:
Deal Gamma to da Moon:
below table contains the total -Call-OI & Put-OI & Put/Call Ratio at each strike price over all expiry series.
SPY (monthly+ weekly)
ranked by highest Call-OI"
top 5 call-OI:
A 350
B 360
C 380
D 400
E 355
FOMO, Euphoria.
surprised?
Deal Gamma to da Moon:
below table contains the total -Call-OI & Put-OI & Put/Call Ratio at each strike price over all expiry series.
SPY (monthly+ weekly)
ranked by highest Call-OI"
top 5 call-OI:
A 350
B 360
C 380
D 400
E 355
FOMO, Euphoria.
surprised?

OI wall:
below table contains the total Call-OI & Put-OI & Put/Call Ratio at each strike price over all expiry series.
SPX + SPXW (monthly+ weekly)
ranked by highest Call-OI"
below table contains the total Call-OI & Put-OI & Put/Call Ratio at each strike price over all expiry series.
SPX + SPXW (monthly+ weekly)
ranked by highest Call-OI"

Long-term correlation
SPTM composite IV-30 (weighted avg) vs VIX=97%
SPTM
=S&P-1500 Composite Stocks
=S&P500 + S&P400 + S&P600
When short-term SPTM composite IV-30 (weighted avg) divergent from VIX
=> Corr< 0
market top is in🧐
below 4 Jaws predicted VIX spike & SPX drop💯
SPTM composite IV-30 (weighted avg) vs VIX=97%
SPTM
=S&P-1500 Composite Stocks
=S&P500 + S&P400 + S&P600
When short-term SPTM composite IV-30 (weighted avg) divergent from VIX
=> Corr< 0
market top is in🧐
below 4 Jaws predicted VIX spike & SPX drop💯

Why the correlation divergence in the short-term?
simple
daily algo VIX suppression manipulation
or Fed VIX suppression🤣
the goal of this study is to detect the "anomaly" from VIX & aggregate stock's implied volatility
they can't manipulate all 1500 stocks Implied Vol🧐😉
simple
daily algo VIX suppression manipulation
or Fed VIX suppression🤣
the goal of this study is to detect the "anomaly" from VIX & aggregate stock's implied volatility
they can't manipulate all 1500 stocks Implied Vol🧐😉
#MRNA - Insider trading detected.. 😎 $spy 007 😎🧐
call Volume yesterday = 174,858
the day before = 46,302
something must be up..
Vaccine optimism soon?
call Volume yesterday = 174,858
the day before = 46,302
something must be up..
Vaccine optimism soon?

"call lotto ticket" at the close strategy?
below table=top 44 S&P-500 & QQQ stocks
stats from 2012-12-5
gap-up-sum = total gap up pts
gap-dn-sum = total gap down pts
gap-up-dn-diff = net gap ps
ranked by "gap-up-dn-diff".
top rank=all tech high flying stocks
surprised?🧐😎
below table=top 44 S&P-500 & QQQ stocks
stats from 2012-12-5
gap-up-sum = total gap up pts
gap-dn-sum = total gap down pts
gap-up-dn-diff = net gap ps
ranked by "gap-up-dn-diff".
top rank=all tech high flying stocks
surprised?🧐😎

by popular demand:
added:
1 Gap Up Pct Sum
2 Gap Dn Pct Sum
3 Gap Up Pct Sum - Gap Dn Pct Sum
4 Gap Up Pct Avg
5 Gap Dn Pct Avg
6 Total Gap Up days
7 Total Gap Dn days
ranked by #3 = gap-up-dn-pct-diff
added:
1 Gap Up Pct Sum
2 Gap Dn Pct Sum
3 Gap Up Pct Sum - Gap Dn Pct Sum
4 Gap Up Pct Avg
5 Gap Dn Pct Avg
6 Total Gap Up days
7 Total Gap Dn days
ranked by #3 = gap-up-dn-pct-diff

$MRNA - more vaccine optimism
Call Volume yesterday = 244,446
Call-OI = 223,117
tons of day-trading #MRNA options
call-volume increased drastically, but, call-OI not much
put-volume also surged
$MRNA Implied Volatility (IV) surged above 116%
$MRNA IV all -time high > 200%
Call Volume yesterday = 244,446
Call-OI = 223,117
tons of day-trading #MRNA options
call-volume increased drastically, but, call-OI not much
put-volume also surged
$MRNA Implied Volatility (IV) surged above 116%
$MRNA IV all -time high > 200%

$SPY Options stats
$SPY smart money "crash protection" puts to Da Moon
huge put-volume
Volume-PCR = 1.92 & 2.01 the last 2 days
OI-PCR = 1.64 & 1.62
$VIX crushed & puts expired worthless
mission accomplished😉
in short-term
$SPY $SPX PCR became a good contrarian indicator🤣
$SPY smart money "crash protection" puts to Da Moon
huge put-volume
Volume-PCR = 1.92 & 2.01 the last 2 days
OI-PCR = 1.64 & 1.62
$VIX crushed & puts expired worthless
mission accomplished😉
in short-term
$SPY $SPX PCR became a good contrarian indicator🤣

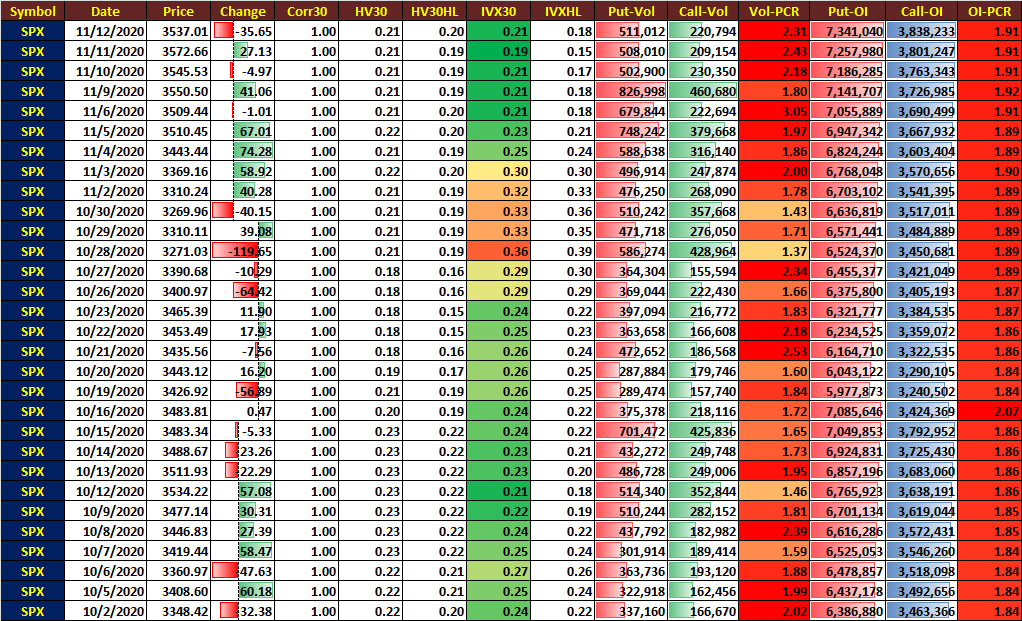
$SPX Options stats
massive "crash protection" put-volume
Volume-PCR = 2.31 & 2.43 the last 2 days
OI-PCR = 1.91
$VIX crushed & puts expired worthless
mission accomplished 🧐
in short-term
$SPY $SPX PCR became a good contrarian indicator 😎
massive "crash protection" put-volume
Volume-PCR = 2.31 & 2.43 the last 2 days
OI-PCR = 1.91
$VIX crushed & puts expired worthless
mission accomplished 🧐
in short-term
$SPY $SPX PCR became a good contrarian indicator 😎
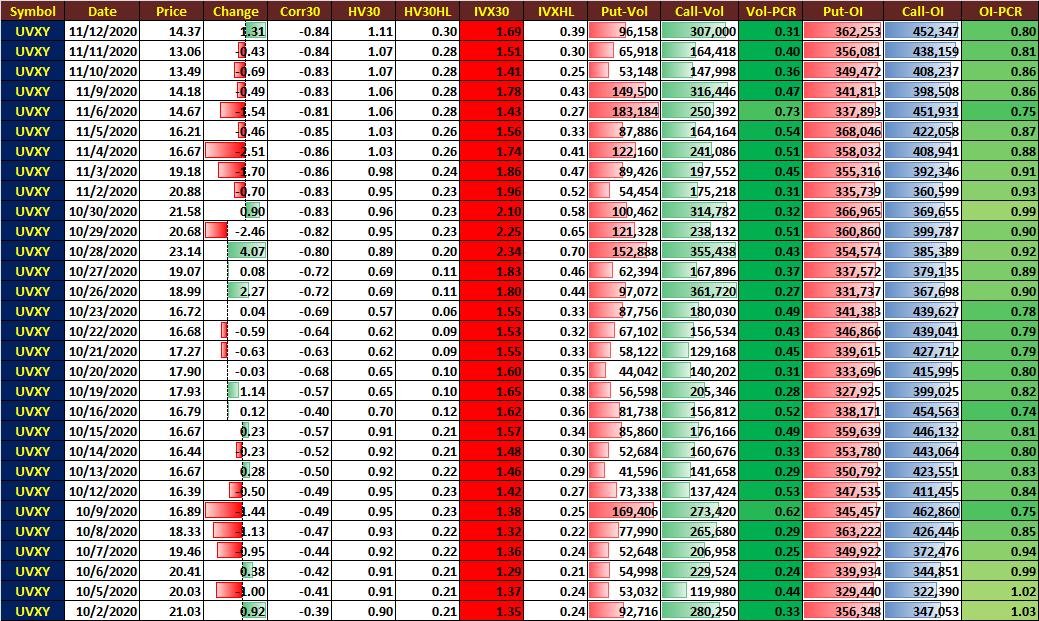
$UVXY options stats
$UVXY "crash protection" calls
Volume-PCR = 0.31 & 0.40 the last 2 days
OI-PCR = 0.80
$VIX crushed &
$UVXY calls expired worthless
mission accomplished.🧐
another short-term contrarian indicator when at extremes😎
$UVXY "crash protection" calls
Volume-PCR = 0.31 & 0.40 the last 2 days
OI-PCR = 0.80
$VIX crushed &
$UVXY calls expired worthless
mission accomplished.🧐
another short-term contrarian indicator when at extremes😎
AAII Sentiment Survey Past Results.
in Table form.
Last time we saw this bullish:
all green cells across the rows
was in Dec 2019 & Jan 2020 ..
Also
Bullish - Bearish difference = 31%
last time the difference at 44% was in Jan 4 2018
all-in
FOMO
Euphoria
super bullish++🦃
in Table form.
Last time we saw this bullish:
all green cells across the rows
was in Dec 2019 & Jan 2020 ..
Also
Bullish - Bearish difference = 31%
last time the difference at 44% was in Jan 4 2018
all-in
FOMO
Euphoria
super bullish++🦃

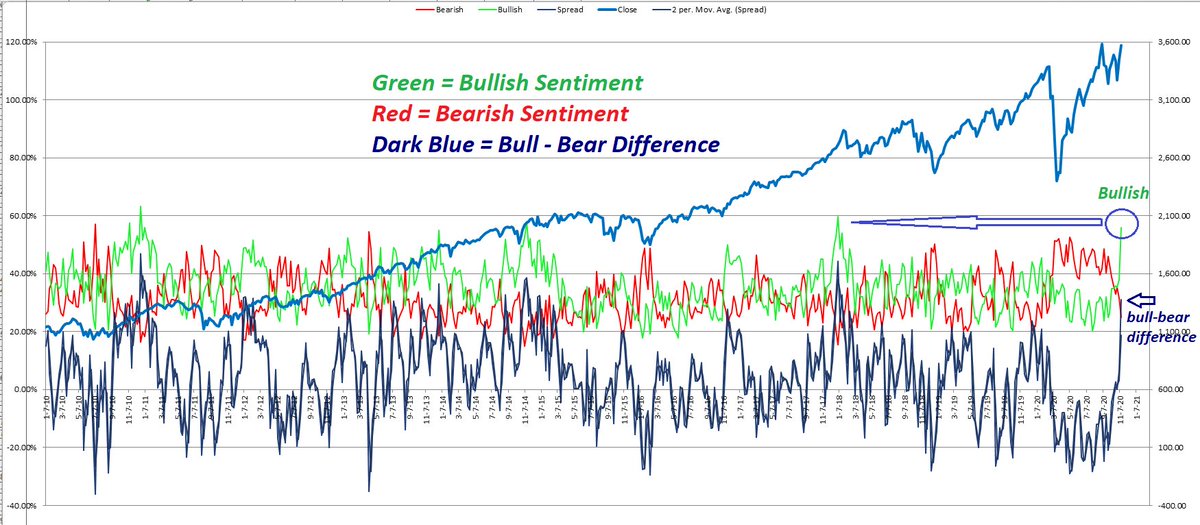
AAII Sentiment: Chart from 2010 - 2020
Green = Bullish
Red = Bearish
Blue = bulls - bears difference
bulls - bears diff = a good contrarian indicator
Not as good as Equity Put/Call ratio.
but,
when these two are aligned with other inds, market top would always come in days🧐
Green = Bullish
Red = Bearish
Blue = bulls - bears difference
bulls - bears diff = a good contrarian indicator
Not as good as Equity Put/Call ratio.
but,
when these two are aligned with other inds, market top would always come in days🧐
AAII Sentiment: table from Late 2017 - Early 2018
#Volmageddon on Feb 5th 2018
marked oval for the "super bullish - FOMO" days just prior to the #Volmageddon
On Jan 4 2018:
bull = 59.8%
bear = 15.5%
bull - bear difference = 44% = highest since 2003/04
super bullish++🦃
#Volmageddon on Feb 5th 2018
marked oval for the "super bullish - FOMO" days just prior to the #Volmageddon
On Jan 4 2018:
bull = 59.8%
bear = 15.5%
bull - bear difference = 44% = highest since 2003/04
super bullish++🦃

Million $ strategy😉
$VIX long strategy or for confirmation to the other $VIX long leading inds
Also can be used for "STFR" & lotto scale-in when near ATHs
1 Bears-Bull Spread at swing low
2 the drop should be swift: at least>20 pts
3 bears=same
4 Long $VIX or $SPY put Lotto🧐
$VIX long strategy or for confirmation to the other $VIX long leading inds
Also can be used for "STFR" & lotto scale-in when near ATHs
1 Bears-Bull Spread at swing low
2 the drop should be swift: at least>20 pts
3 bears=same
4 Long $VIX or $SPY put Lotto🧐

no quiz this weekend?😉
Super accurate breadth ind
Very high correlation with $VIX
(hint: not PCR, VVIX or SKEW, etc)
two zones
Greed=thin yellow line
Euphoria=Thick yellow line
scale-in when < Greed-zone
more when < Euphoria-zone
breadth confluence = better accuracy🧐
Super accurate breadth ind
Very high correlation with $VIX
(hint: not PCR, VVIX or SKEW, etc)
two zones
Greed=thin yellow line
Euphoria=Thick yellow line
scale-in when < Greed-zone
more when < Euphoria-zone
breadth confluence = better accuracy🧐

Daily summary of Options Stats from previous day
Major indices, sector ETFs, Fang+ stocks, VIX, HYG etc.
Big picture in the Options mkt
ranked by volume PCR
Indices & sector ETF are always on the top (hedging)
FANG+ stocks are always super bullish
$EEM ? anomaly, flipped
Major indices, sector ETFs, Fang+ stocks, VIX, HYG etc.
Big picture in the Options mkt
ranked by volume PCR
Indices & sector ETF are always on the top (hedging)
FANG+ stocks are always super bullish
$EEM ? anomaly, flipped

re:
Berkshire Continued To Dump Banks, Bought New Stakes In Pharma Giants In Q3
-Buffett is a value investor
see below stats
calculated from individual stocks in the sector/index holdings-weighted avg
last two columns specify the %buy / %call ratio for both factors
#1 $XLV
Berkshire Continued To Dump Banks, Bought New Stakes In Pharma Giants In Q3
-Buffett is a value investor
see below stats
calculated from individual stocks in the sector/index holdings-weighted avg
last two columns specify the %buy / %call ratio for both factors
#1 $XLV

Beneath the surface, the momentum high flying stocks continued the underperformance relative to XLP - staple stocks.
sector rotation out of momentum stocks continued
the SPY-MTYM spread Z-score = -1.19 sigma (stdev)
sector rotation out of momentum stocks continued
the SPY-MTYM spread Z-score = -1.19 sigma (stdev)

XLY-XLP spread Z-score = 1.04 sigma

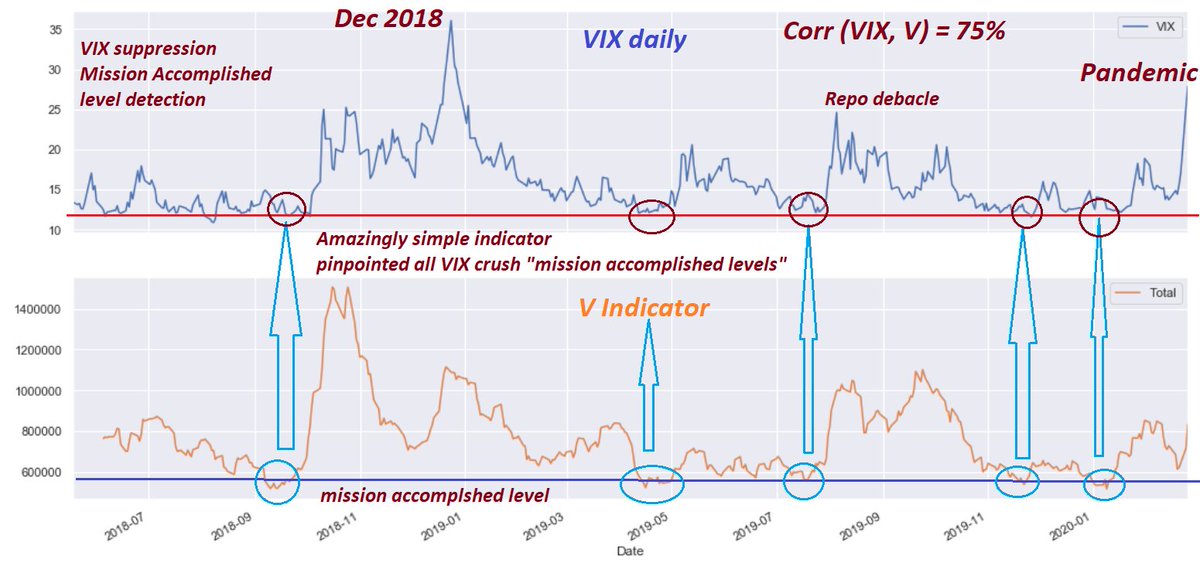
🤣Breakthrough in catching all "mission accomplished" VIX crush levels since mid 2018🧐
100% accurate
this indicator is so odd & simple, yet so accurate, I can't believe my eyes🤦♂️
ML algos can do magic in finding odd correlations ON; no sleep🔥
100% accurate
this indicator is so odd & simple, yet so accurate, I can't believe my eyes🤦♂️
ML algos can do magic in finding odd correlations ON; no sleep🔥
BofA Fund Mgr Survey
Not only small investors in AAII sentiment survey showed extreme bullishness, BofA Fund Mgr survey also showing similar pattern
when all Fund Mgrs capitulated, we should all be super bullish. 2002, 2008/09, Jan 2019, Mar 2020
super leading contrarian ind🧐
Not only small investors in AAII sentiment survey showed extreme bullishness, BofA Fund Mgr survey also showing similar pattern
when all Fund Mgrs capitulated, we should all be super bullish. 2002, 2008/09, Jan 2019, Mar 2020
super leading contrarian ind🧐

Quiz
Does M1 Money Supply have anything to do with #BitCoin?
Of course
"Drug liquidity injection" would always find the most riskiest asset classes.
M1 is a amazing magnet for #BitCoin
amazing #BitCoin meteoric rise
from -60% in Mar to +47% today relative to July 2019 lvl
Does M1 Money Supply have anything to do with #BitCoin?
Of course
"Drug liquidity injection" would always find the most riskiest asset classes.
M1 is a amazing magnet for #BitCoin
amazing #BitCoin meteoric rise
from -60% in Mar to +47% today relative to July 2019 lvl

$VIX and #T-Indicator Regime Change
pre-volmageddon:
euphoria zone = #T-Ind below 0.54 (purple)
post-volmageddon:
euphoria zone = #T-Ind below 0.62 (purple)
Yesterday = 0.68 (getting there)
the $VIX & #T-ind regime change is quite obvious.
90% accurate - leading by a few days
pre-volmageddon:
euphoria zone = #T-Ind below 0.54 (purple)
post-volmageddon:
euphoria zone = #T-Ind below 0.62 (purple)
Yesterday = 0.68 (getting there)
the $VIX & #T-ind regime change is quite obvious.
90% accurate - leading by a few days

Max Pain for $SPX & $SPXW
wonder why the sudden drop before the close?
vaccine pessimism?
or
selling "vaccine optimism" news?
see below Max Pain🧐
The last column is today's $SPX closing price
the OI data was from yesterday's trading
today's OI would be available tomorrow
wonder why the sudden drop before the close?
vaccine pessimism?
or
selling "vaccine optimism" news?
see below Max Pain🧐
The last column is today's $SPX closing price
the OI data was from yesterday's trading
today's OI would be available tomorrow

$SPX correlation with various volume PCRs for different periods
10-day, 30-day to 200-day correlations
1 SPX vs SPX: corr always = 1 for all periods
2 SPX vs VIX: corr always negative for all periods
3 SPX vs Equity PCR: corr negative for 5 out of 6 periods
4 SPX vs Total PCR
10-day, 30-day to 200-day correlations
1 SPX vs SPX: corr always = 1 for all periods
2 SPX vs VIX: corr always negative for all periods
3 SPX vs Equity PCR: corr negative for 5 out of 6 periods
4 SPX vs Total PCR

Quiz: 😉
Correlation between:
SPX vs SPX OI-PCR = positive across all periods
from 10-day to 200-day correlation
what does this mean? 🧐
Tons of SPX puts implying/predicting bearishness or bullishness for $SPX approaching OpEx?
Quiz.
math prediction for SPX OI-PCR upon OpEx.
Correlation between:
SPX vs SPX OI-PCR = positive across all periods
from 10-day to 200-day correlation
what does this mean? 🧐
Tons of SPX puts implying/predicting bearishness or bullishness for $SPX approaching OpEx?
Quiz.
math prediction for SPX OI-PCR upon OpEx.

$VIX and #T-Indicator
self adapting zone:
1 top band = capitulation zone
= collecting premium strategy
2 bottom band = euphoria zone
= long VIX/Gamma strategy
not 100% accurate,
but with high probability, if it is confluent with other leading indicators 👌🧐
self adapting zone:
1 top band = capitulation zone
= collecting premium strategy
2 bottom band = euphoria zone
= long VIX/Gamma strategy
not 100% accurate,
but with high probability, if it is confluent with other leading indicators 👌🧐

SPX vs Equity CPR: negatively correlated, better than 75% for longer period
Equity-CPR = Equity-PCR (inverted)
below chart
SPX vs Equity-CPR (10-day SMA) correlation.
amazing correlation.
Equity-CPR = Equity-PCR (inverted)
below chart
SPX vs Equity-CPR (10-day SMA) correlation.
amazing correlation.

NYSE total Short Interest (SI) vs $SPX
what is the relationship b/w $SPX & NYSE-SI?
yep, they are negatively correlated
shocking corr = -61% 2015 - 2020
since Jan 2018
if
NYSE-SI = swing low = Short capitulation = $SPX ATH
then
rug pull in days 🧐
this time is different?🤦♂️
what is the relationship b/w $SPX & NYSE-SI?
yep, they are negatively correlated
shocking corr = -61% 2015 - 2020
since Jan 2018
if
NYSE-SI = swing low = Short capitulation = $SPX ATH
then
rug pull in days 🧐
this time is different?🤦♂️

QQQ-103 Stocks Short Interest as of Oct 30 reporting
This table contains tons of info
top 50 QQQ short stocks
ranked by Short Interest % of Float.
Also pay attention to Short Ratio = Days to Cover
This table contains tons of info
top 50 QQQ short stocks
ranked by Short Interest % of Float.
Also pay attention to Short Ratio = Days to Cover

QQQ-103 Stocks Short Interest as of Oct 30 reporting
This table contains tons of info
bottom 50 QQQ short stocks
ranked by Short Interest % of Float.
Also pay attention to Short Ratio = Days to Cover
This table contains tons of info
bottom 50 QQQ short stocks
ranked by Short Interest % of Float.
Also pay attention to Short Ratio = Days to Cover

Ranked by short interest % change from last a month ago.
top 22 and bottom 22 highest and lowest % SI Change.
AMD? (shorts were right or short squeeze coming?)🧐
top 22 and bottom 22 highest and lowest % SI Change.
AMD? (shorts were right or short squeeze coming?)🧐

A fair Comparison
$SPX vs $GEX: 2011 to 2020
Correlation=40%
$SPX vs Equity C/P Ratio
Correlation=45%
similar divergences at the top when $SPX near ATH
conclusion
Option's Gamma (GEX) highly correlated with equity Call/Put Ratio
CPR has a better corr with $SPX than GEX🧐
$SPX vs $GEX: 2011 to 2020
Correlation=40%
$SPX vs Equity C/P Ratio
Correlation=45%
similar divergences at the top when $SPX near ATH
conclusion
Option's Gamma (GEX) highly correlated with equity Call/Put Ratio
CPR has a better corr with $SPX than GEX🧐

$GEX vs Equity Call/Put Ratio
shockingly high correlation:
Corr ( $GEX, Equity CPR, 9 year) = 54%
$GEX undershoots often
#Equty-CPR overshoots often
But the peaks and valleys offered similar shape.
shockingly high correlation:
Corr ( $GEX, Equity CPR, 9 year) = 54%
$GEX undershoots often
#Equty-CPR overshoots often
But the peaks and valleys offered similar shape.

Amazing. Shocking.
$SPX & $DIX are not correlated at all.
Correlation = -0.04
zero correlation since 2011 = Coin Tossing
DIX would work 55% of the time
no edge by using it as a standalone indicator
but, good for confirmation signal to other leading indicators.
PCR is better
$SPX & $DIX are not correlated at all.
Correlation = -0.04
zero correlation since 2011 = Coin Tossing
DIX would work 55% of the time
no edge by using it as a standalone indicator
but, good for confirmation signal to other leading indicators.
PCR is better

Interesting.
$VIX & $DIX are positively correlated=0.36
can't be used as a stand alone indicator for buy & sell decisions. Used for confirmation is okay
not as reliable as other breadth leading inds, including the simple Equity PCR
When DIX is rising, so does VIX; long VIX?🧐
$VIX & $DIX are positively correlated=0.36
can't be used as a stand alone indicator for buy & sell decisions. Used for confirmation is okay
not as reliable as other breadth leading inds, including the simple Equity PCR
When DIX is rising, so does VIX; long VIX?🧐

final post on $GEX🧐
normalized $GEX b/w 0 & 1
so it is similar to put/call ratio scale
very important for "vastly different scaled inputs" to ML
all inputs should be normalized or min-max scaled to the same level
then smoothed by rolling avg
clear
fear & capitulation
levels
normalized $GEX b/w 0 & 1
so it is similar to put/call ratio scale
very important for "vastly different scaled inputs" to ML
all inputs should be normalized or min-max scaled to the same level
then smoothed by rolling avg
clear
fear & capitulation
levels

The last final post on $GEX😉
Standardized the $GEX to Z-Score with mean = 0
Fear zone = -1 stdev below mean (68%)
Capitulation zone = -2 stdev below mean (95%)
Greed = +2 stdev
Euphoria Zone = +3 stdev (99.7%)
Max Optimism = +4 stdev; every 43 years (twice in a lifetime)🤣
Standardized the $GEX to Z-Score with mean = 0
Fear zone = -1 stdev below mean (68%)
Capitulation zone = -2 stdev below mean (95%)
Greed = +2 stdev
Euphoria Zone = +3 stdev (99.7%)
Max Optimism = +4 stdev; every 43 years (twice in a lifetime)🤣

Fear and Greed Index
Today = 77 = extreme greed
see below fear & greed over time.
Best contrarian indicator ever plus Trump "market top" indicator --> pinpointing all the major cycle highs🤣
getting there😉
Today = 77 = extreme greed
see below fear & greed over time.
Best contrarian indicator ever plus Trump "market top" indicator --> pinpointing all the major cycle highs🤣
getting there😉

On Jan 2
I was lucky to catch the highest F&G reading on record
F&G=97; intraday 98
see below thread on the progress of F&G index in Dec 2019 & Jan 2020
amazing insider trading & bull trap, knowing the Virus would hit the market soon. rigged & planned
I was lucky to catch the highest F&G reading on record
F&G=97; intraday 98
see below thread on the progress of F&G index in Dec 2019 & Jan 2020
amazing insider trading & bull trap, knowing the Virus would hit the market soon. rigged & planned
https://twitter.com/kerberos007/status/1212842900536598528
QQQ top 40 stocks with:
highest market-value / book-value ratio
= Price to Book ratio
= PB ratio
$TSLA PE (TTM) = 1062
and
Price-to-Book ratio = 32.8
top 6 price-to-book companies:
ADSK
CTXS
MAR
ZM
IDXX
DOCU
surprised? 🧐 ZM on the list.
highest market-value / book-value ratio
= Price to Book ratio
= PB ratio
$TSLA PE (TTM) = 1062
and
Price-to-Book ratio = 32.8
top 6 price-to-book companies:
ADSK
CTXS
MAR
ZM
IDXX
DOCU
surprised? 🧐 ZM on the list.

Another shocking finding today:
top chart = $VIX vs Equity put/call ratio (blue)
bottom chart = $VIX vs $DIX (green)
we know both equity-PCR & $DIX are positively correlated with $VIX
VIX = 21.64 (Red) flat.
Equity-PCR = 0.38 (Blue)
DIX = 0.38 (Green)
amazing coincidence?🤣
top chart = $VIX vs Equity put/call ratio (blue)
bottom chart = $VIX vs $DIX (green)
we know both equity-PCR & $DIX are positively correlated with $VIX
VIX = 21.64 (Red) flat.
Equity-PCR = 0.38 (Blue)
DIX = 0.38 (Green)
amazing coincidence?🤣

How to trade Equity PCR?
Standardized (then normalized) Equity PCR Z-score
-1 sigma = Over-sold Zone
-2 sigma = Fear Zone
-3 sigma = Capitulation Zone
if PCR z-score reaching below -1.5 or -2 sigma
= high probability of a $VIX spike in days
scale-in VIX long lotto tickets🧐👌
Standardized (then normalized) Equity PCR Z-score
-1 sigma = Over-sold Zone
-2 sigma = Fear Zone
-3 sigma = Capitulation Zone
if PCR z-score reaching below -1.5 or -2 sigma
= high probability of a $VIX spike in days
scale-in VIX long lotto tickets🧐👌

For $SPX STFR lotto tickets:
above definition should be reversed.
-1 sigma = Over-Bought Zone
-2 sigma = Greed Zone
-3 sigma = Euphoria Zone
above definition should be reversed.
-1 sigma = Over-Bought Zone
-2 sigma = Greed Zone
-3 sigma = Euphoria Zone
VIX stats from 2006: 3800 days
color coded "fear & greed" zones
Samples= 3800 days
mean = 19.40
stdev = 9.61
min = 9.14
25% = 13.14
50% = 16.37
75% = 22.54
max = 82.69
2020 $VIX high ~= 6.5 sigma
intraday VIX high = 7 sigma
green = greed
red = fear
color coded "fear & greed" zones
Samples= 3800 days
mean = 19.40
stdev = 9.61
min = 9.14
25% = 13.14
50% = 16.37
75% = 22.54
max = 82.69
2020 $VIX high ~= 6.5 sigma
intraday VIX high = 7 sigma
green = greed
red = fear

IF $VIX daily return is a perfect normal distribution (options modeling assumption) then:
6 sigma = every 1.38 million yrs
7 sigma = every 1.07 billion yrs
we had two in 10 years, and three in 33 year
the options modeling vastly underestimated the left tail risk🦃
6 sigma = every 1.38 million yrs
7 sigma = every 1.07 billion yrs
we had two in 10 years, and three in 33 year
the options modeling vastly underestimated the left tail risk🦃
🦃 day Quiz:
speaking of the "left tail risk" or "turkey 1001-day", how to estimate the left tail risk from options chains?
KEY:
it is called "SKEW"
1 negative put $SKEW = fat left tail (hedging for crash)
2 positive call $SKEW = fat right tail (hedging for melt-up)
speaking of the "left tail risk" or "turkey 1001-day", how to estimate the left tail risk from options chains?
KEY:
it is called "SKEW"
1 negative put $SKEW = fat left tail (hedging for crash)
2 positive call $SKEW = fat right tail (hedging for melt-up)
for a given expiry series:
negative $SKEW = OTM put premium (or IV) is much higher than the OTM call premium
meaning people buying more puts for down-side protection & willing to pay high premium, driving OTM put IV higher than OTM call IV
positive $SKEW = OTM call IV > Put IV
negative $SKEW = OTM put premium (or IV) is much higher than the OTM call premium
meaning people buying more puts for down-side protection & willing to pay high premium, driving OTM put IV higher than OTM call IV
positive $SKEW = OTM call IV > Put IV
Since 1987 crash, all fund managers have been extremely cautious, using index options to hedge their long stock portfolio to avoid another crash (VIX ~= 150 est.)
hence,
since 1987, all index options (SPX, SPY, QQQ, IWM etc) exhibiting much higher $SKEW than stocks options
hence,
since 1987, all index options (SPX, SPY, QQQ, IWM etc) exhibiting much higher $SKEW than stocks options
How to estimate IV $SKEW from a given expiry series?
from $SKEW, we can guess "bullishness/bearishness" of a stock/ETF
many methodologies using "IV smile" curve
1 by OTM put & call delta (+-25 delta)
2 by OTM moneyness (+-10% from ATM strike)
3 by put-IV slope & call-IV slope
from $SKEW, we can guess "bullishness/bearishness" of a stock/ETF
many methodologies using "IV smile" curve
1 by OTM put & call delta (+-25 delta)
2 by OTM moneyness (+-10% from ATM strike)
3 by put-IV slope & call-IV slope
my own methodology:
4 I use the combination of the above three methodology
5 average the three using the below formula for normalization
6 (OTM put IV - OTM call IV) / ATM call IV
7 by normalizing (divided by) ATM call IV, it's possible to compare $SKEWS among different assets
4 I use the combination of the above three methodology
5 average the three using the below formula for normalization
6 (OTM put IV - OTM call IV) / ATM call IV
7 by normalizing (divided by) ATM call IV, it's possible to compare $SKEWS among different assets
Now, real-world examples
$AAPL Jan 15 expiry
IV smile
$AAPL IV SKEW is almost zero= no fun
Options players are neutral
three IVs: 10% moneyness
A OTM call IV (10%) ==> right side of ATM stk
B OTM put IV (-10%) =-> left side of the ATM stk
C ATM call IV
SKEW = (A - B) / C
$AAPL Jan 15 expiry
IV smile
$AAPL IV SKEW is almost zero= no fun
Options players are neutral
three IVs: 10% moneyness
A OTM call IV (10%) ==> right side of ATM stk
B OTM put IV (-10%) =-> left side of the ATM stk
C ATM call IV
SKEW = (A - B) / C

For $AAPL above, I was using +-10% moneyness to calculate OTM call IV & OTM put IV vs ATM call IV
$AAPL IV smile
OTM call strike=ATM call strike + 0.1 * ATM call strike
OTM put strike=ATM call strike - 0.1 * ATM call strike.
ATM call strike ~= 117
SKEW ~= 0
perfect IV smile🤣
$AAPL IV smile
OTM call strike=ATM call strike + 0.1 * ATM call strike
OTM put strike=ATM call strike - 0.1 * ATM call strike.
ATM call strike ~= 117
SKEW ~= 0
perfect IV smile🤣

As discussed, fund mgrs buying Index OTM puts for hedging the crash, driving index put IV higher than the call IV
almost all index options' $SKEW's are neg
below: QQQ IV smile & SKEW= -0.45
fat left tail IV (premium), lotto tickets spiking even higher upon VIX explosion 🦃
almost all index options' $SKEW's are neg
below: QQQ IV smile & SKEW= -0.45
fat left tail IV (premium), lotto tickets spiking even higher upon VIX explosion 🦃

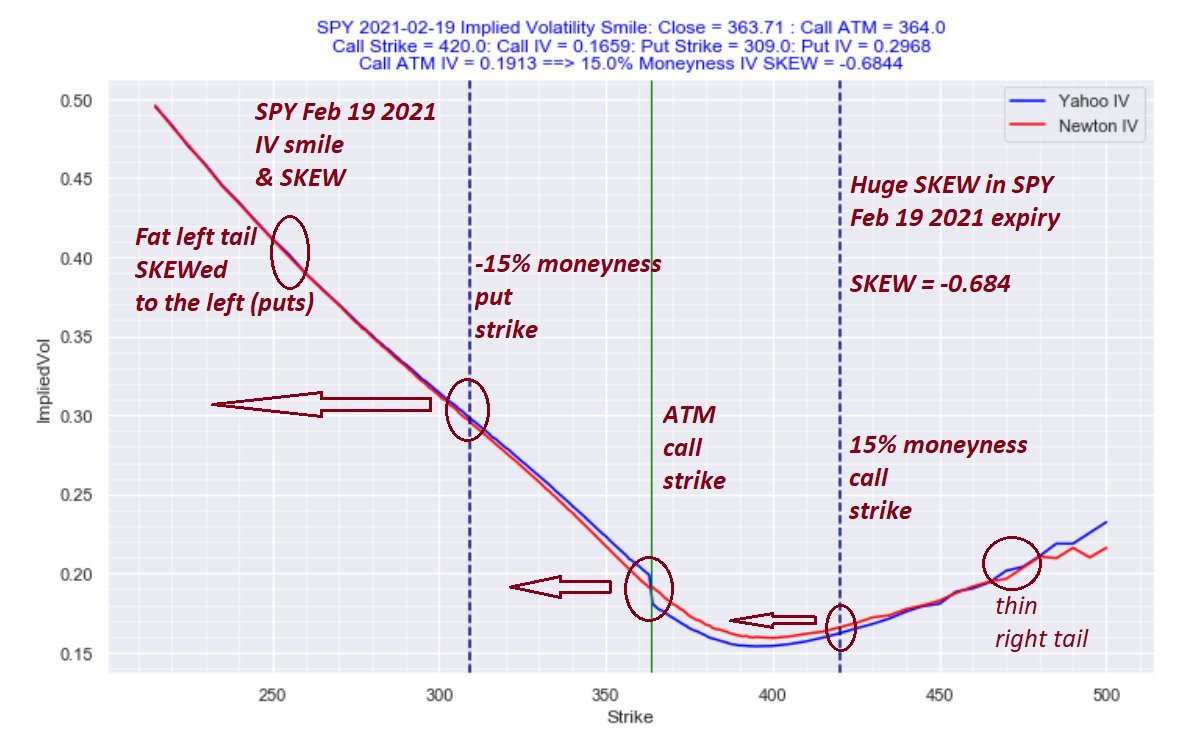
real world examples: crash protection examples
$SPY IV smile & $SKEW= -0.684 (heavily skewed to the negative (put) side.
huge left tail hedging by the fund managers
OTM put IV >> OTM call IV & ATM call IV
moneyness = +- 15% from ATM call strike
$SPY IV smile & $SKEW= -0.684 (heavily skewed to the negative (put) side.
huge left tail hedging by the fund managers
OTM put IV >> OTM call IV & ATM call IV
moneyness = +- 15% from ATM call strike
trading opportunity arises, combining below 6 daily options stats over time, averaging from short-to-medium term options expiries
1 implied vol
2 realized vol
3 SKEW
4 Gamma
5 put/call ratio
6 volume & OI
there're correlations among above related items for directional bias🧐
1 implied vol
2 realized vol
3 SKEW
4 Gamma
5 put/call ratio
6 volume & OI
there're correlations among above related items for directional bias🧐
People asking about the $SPY $SKEW over all expiries
important info for $SKEW & spread traders, hedgers, long/short premium and calendar arbitragers👌
pay attention to🧐
1 ExpireDate
2 Call ATM IV
3 IV SKEW (IV calculated using moneyness/delta call/put)
4 call IV - put IV diff
important info for $SKEW & spread traders, hedgers, long/short premium and calendar arbitragers👌
pay attention to🧐
1 ExpireDate
2 Call ATM IV
3 IV SKEW (IV calculated using moneyness/delta call/put)
4 call IV - put IV diff

Not all stocks have the same expiry series as one might expect.
to find common expiry series among diff stocks for comparing IVs, RVs, term structures, skews, p/c ratios, Max Pains, OI & volume, etc.
below table (5-line Python script) would be useful to find the common expiries
to find common expiry series among diff stocks for comparing IVs, RVs, term structures, skews, p/c ratios, Max Pains, OI & volume, etc.
below table (5-line Python script) would be useful to find the common expiries

Included $SPY $QQQ and #IWM options expiry series
in addition to the weekly/monthly options, $SPY also including Monday and Wednesday expiries for the front weeks/month
in addition to the weekly/monthly options, $SPY also including Monday and Wednesday expiries for the front weeks/month

being busy all day.
below is today and last few days' CBOE put/call ratios.
equity-PCR = 0.37
VIX-PCR = 0.64
VIX is up today.
below is today and last few days' CBOE put/call ratios.
equity-PCR = 0.37
VIX-PCR = 0.64
VIX is up today.

NYSE, NYSE Arca, Nasdaq Raw Breadth
Nasdaq "Decline Volume" > "Advance Volume"
pink cells.
interesting.
stealthy distribution?
Nasdaq "Decline Volume" > "Advance Volume"
pink cells.
interesting.
stealthy distribution?

$VIX term structure
Contango = Complacent.
Contango = Complacent.

$VX futures term structure
flat Contango = Complacent
flat Contango = Complacent

Trash High Beta stocks continue to out-perform SPY, and SPLV
SPHB - SP-500 High Beta stock ETF
SPLV - SP-500 Low Volatility stock ETF
SPHB = +2.37 sigma above SPY-SPHB spread mean, surpassing Jan 2018, prior to the #Volmageddon
Bullish ++🦃
SPHB - SP-500 High Beta stock ETF
SPLV - SP-500 Low Volatility stock ETF
SPHB = +2.37 sigma above SPY-SPHB spread mean, surpassing Jan 2018, prior to the #Volmageddon
Bullish ++🦃

SPHB outperforming SPLV by a mile
The SPLV-SPHB spread z-score reached highest ever = 3.7 sigma
what could go wrong?
SPLV = high dividend, minimum volatility, non-cyclical
SPHB = high Beta, speculative, high growth (?), cyclical.
Euphoria ++
Maximum bullish ++
The SPLV-SPHB spread z-score reached highest ever = 3.7 sigma
what could go wrong?
SPLV = high dividend, minimum volatility, non-cyclical
SPHB = high Beta, speculative, high growth (?), cyclical.
Euphoria ++
Maximum bullish ++

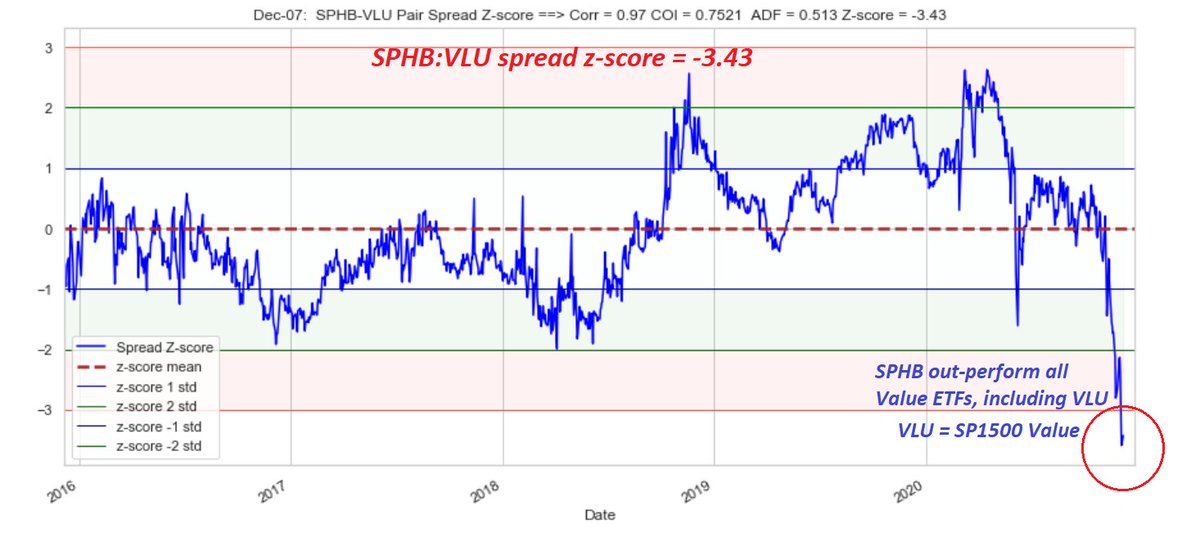
SPHB = SP-500 High Beta ETF
VLU = SP-1500 Value ETF (large, mid, small caps)
SPHB-VLU spread z-score reached lowest level ever.
$SPHB outperforming XLK, QQQ, SPY, SPYG, VLU, SPYV.. you name it.
What could go wrong?
Maximum Optimism++ 🦃
VLU = SP-1500 Value ETF (large, mid, small caps)
SPHB-VLU spread z-score reached lowest level ever.
$SPHB outperforming XLK, QQQ, SPY, SPYG, VLU, SPYV.. you name it.
What could go wrong?
Maximum Optimism++ 🦃
From above Z-score charts, the "value" & "low volatility" alpha factor investing is dead for now
the momentum factor investing has always been superior, even before Fed QE-4ever
many research papers manifesting "momentum factor" from 6-12 months would continue to out-perform
the momentum factor investing has always been superior, even before Fed QE-4ever
many research papers manifesting "momentum factor" from 6-12 months would continue to out-perform
to prove the "momentum factor" investing
below table contains perf key metrics for various Momentum periods
1 momentum factor based on "WQSR" ranking
2 lookback periods from 30-day to 300-day momentum
3 QQQ-103 stocks from 2013 to 2020
4 rebalance weekly selecting top-20 stocks
below table contains perf key metrics for various Momentum periods
1 momentum factor based on "WQSR" ranking
2 lookback periods from 30-day to 300-day momentum
3 QQQ-103 stocks from 2013 to 2020
4 rebalance weekly selecting top-20 stocks

• • •
Missing some Tweet in this thread? You can try to
force a refresh


