Commentary on the @thesundaytimes story 'How the Eldery Paid the Price of Protecting the NHS from COVID-19'.
A Thread.
thetimes.co.uk/article/reveal…
A Thread.
thetimes.co.uk/article/reveal…
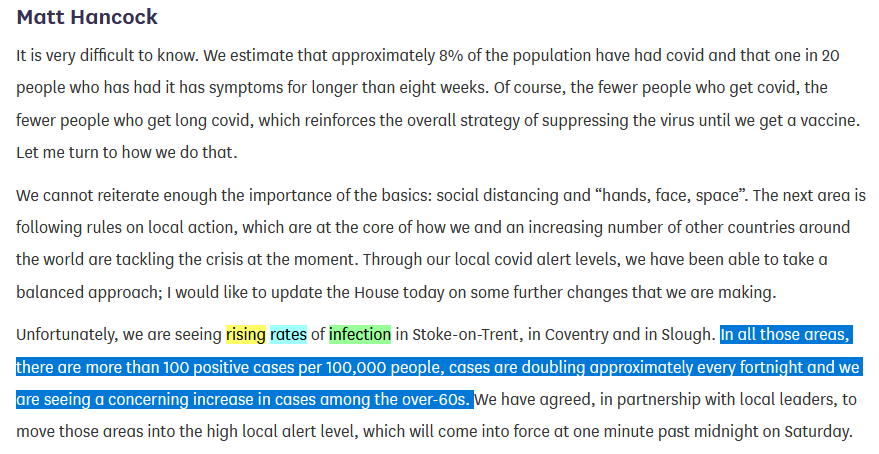
The Sunday Times cover the first wave of the virius, up to May 2020. But the question remains - could it happen again? And what is the Government doing to prevent this?
Let's look at the number of cases in the over-80s
Let's look at the number of cases in the over-80s
https://twitter.com/Dr_D_Robertson/status/1319292649698807813
Eight weeks ago, there were 9 Covid cases per 100,000 over 80s.
Last week, there were *114*
Last week, there were *114*

This is predictable. I predicted this on 8 September. Data from France and Spain was showing cases starting in 20-somethings and then rising through the age groups. duncanrobertson.com/2020/09/08/sho…
But why does this matter? It matters because older people are more likely to die from Covid.
We represent this by the Infection Fatality Rate. Which means: if you are infected with Covid-19, how likely are you to die?
There are various studies on this
nature.com/articles/d4158…
We represent this by the Infection Fatality Rate. Which means: if you are infected with Covid-19, how likely are you to die?
There are various studies on this
nature.com/articles/d4158…
Here's the Infection Fatality Rate (also called IFR) estimate from July 2020 from a report commissioned by @uksciencechief and published by @acmedsci
The main point is - the older you are when you catch Covid, the more likely you are to die.
https://twitter.com/Dr_D_Robertson/status/1283022411424845825.
The main point is - the older you are when you catch Covid, the more likely you are to die.
The whole Academy of Medical Sciences report is worth reading. It's basically the public warning from scientists as at 14 July. Really - if you have a moment, read it. It makes sobering reading.
https://twitter.com/Dr_D_Robertson/status/1306631814849626117
Cases can lead to hospitalizations which can lead to intensitve care / ICU / HDU which can lead to death.
Here are hospitalizations from @PHE_uk for the second wave. We can see 63 per 100,000 population of over 85-year olds being hopsitalized last week.
Here are hospitalizations from @PHE_uk for the second wave. We can see 63 per 100,000 population of over 85-year olds being hopsitalized last week.
https://twitter.com/Dr_D_Robertson/status/1319308802349584385
Here's a chart from @PHE_uk (only some NHS trusts, slightly different age groupings and this is numbers of patients, not proportions of patients in each age group).
As you may expect, older people have been hospitalized more than younger people.
As you may expect, older people have been hospitalized more than younger people.

But compare the shape of the left hand chart (hospitalizations) to the *right hand* chart (ICU cases)
(This is over the course of the whole epidemic and is a subset of cases.)
The right hand chart is ICU cases. It doesn't have the same shape as the left hand chart.
(This is over the course of the whole epidemic and is a subset of cases.)
The right hand chart is ICU cases. It doesn't have the same shape as the left hand chart.

The @thesundaytimes article covers the first wave.
The question remains - what has the Government done in the intervening time - around half a year - to prevent this happening again in this, the second wave?
The question remains - what has the Government done in the intervening time - around half a year - to prevent this happening again in this, the second wave?
Analysis mentioned in the interview:
https://twitter.com/Dr_D_Robertson/status/1320284764323139585
• • •
Missing some Tweet in this thread? You can try to
force a refresh