Commentary on the Slide Pack shown to MPs
'COVID-19 TaskForce: Data briefing 8 October 2020'
Here it is:
assets.publishing.service.gov.uk/government/upl…
h/t @robpowellnews and @Smyth_Chris
'COVID-19 TaskForce: Data briefing 8 October 2020'
Here it is:
assets.publishing.service.gov.uk/government/upl…
h/t @robpowellnews and @Smyth_Chris
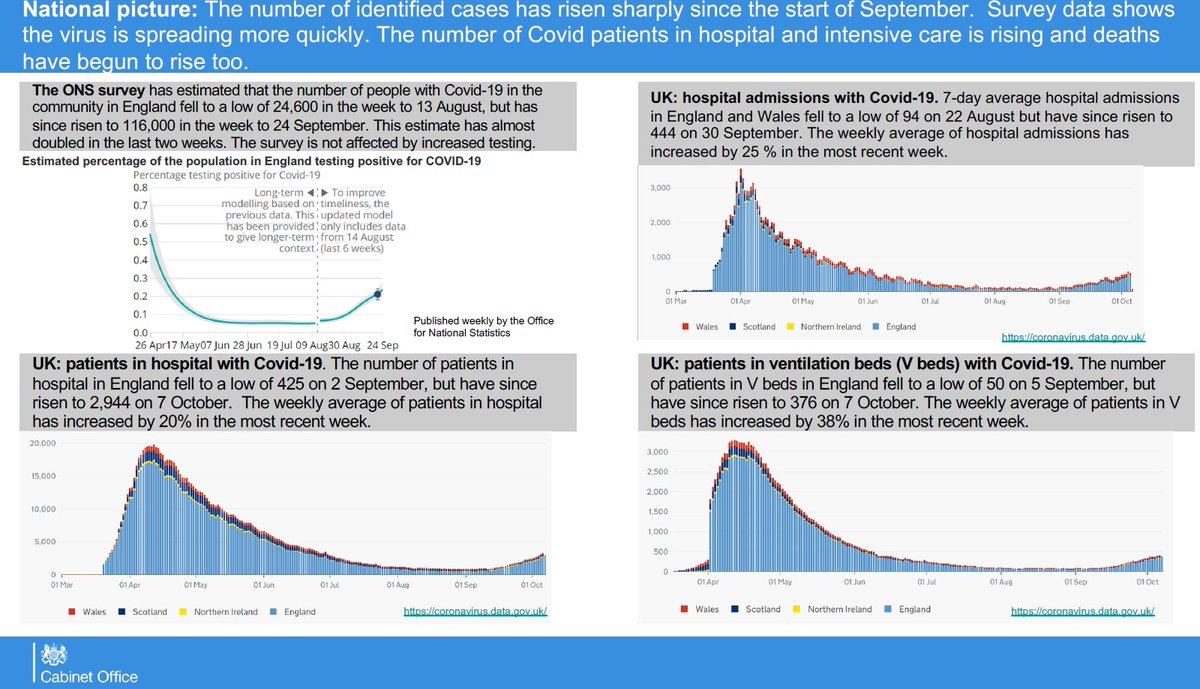
Slide 1
Comment: The ONS survey does not include students in halls of residence so will underestimate due to outbreaks in halls of residence
But, yes, everything points to the epidemic not being under control
See:
Comment: The ONS survey does not include students in halls of residence so will underestimate due to outbreaks in halls of residence
But, yes, everything points to the epidemic not being under control
See:
https://twitter.com/Dr_D_Robertson/status/1313027943640297476
Slide 2
Shows cases above 50 per 100,000. This is good. However, note several colour shades above this - not just the dark purple (and why no scale?)
Shows cases above 50 per 100,000. This is good. However, note several colour shades above this - not just the dark purple (and why no scale?)
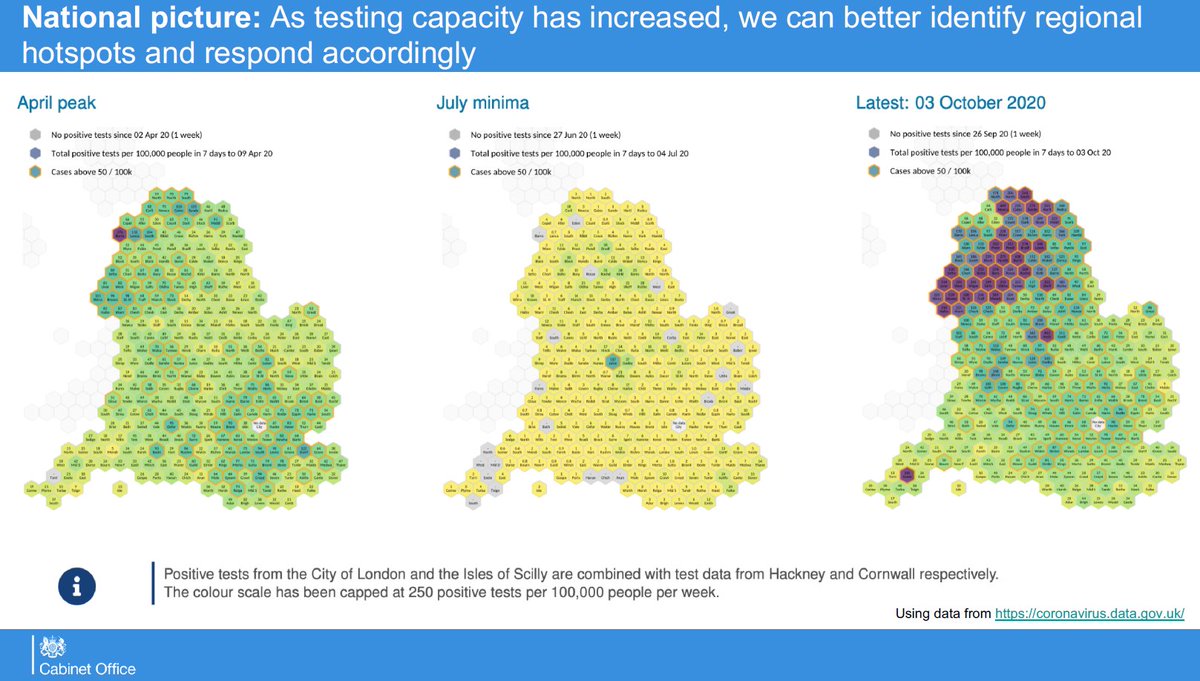
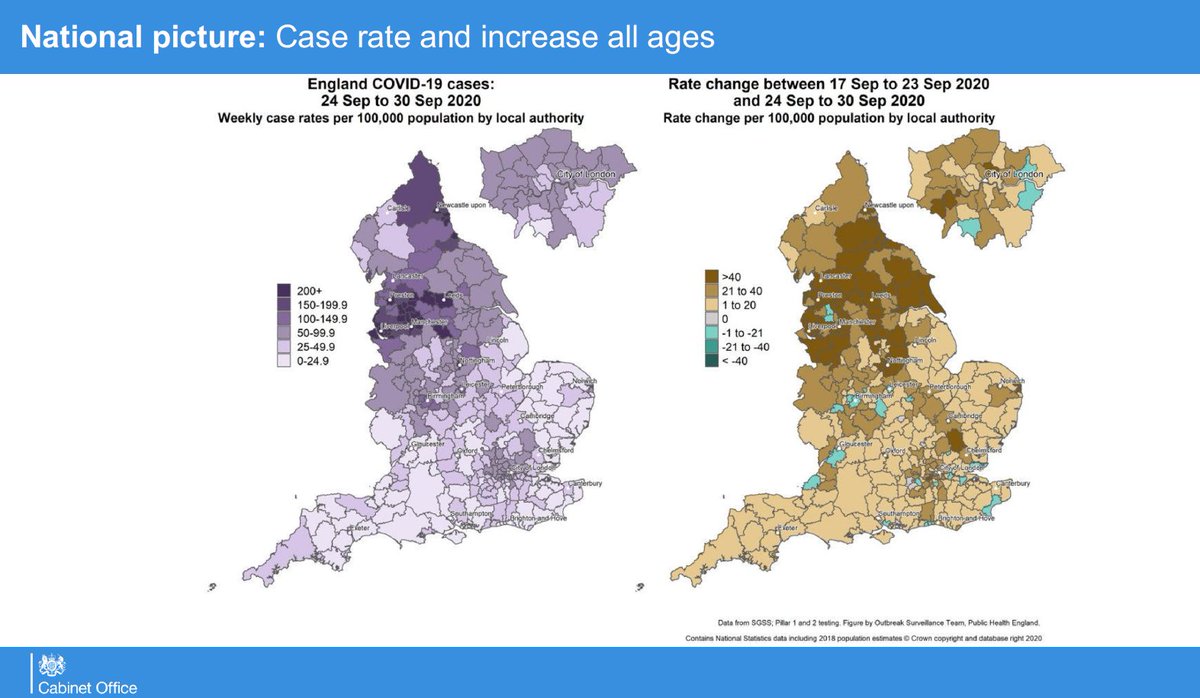
Slide 3
This is not the same colour scale as used in 30 September briefing (actually more conservative / 'less scary')
See this thread for why this can change perceptions:
Focus on areas with >50 cases per 100,000 - that was ~ the watchlist threshold
This is not the same colour scale as used in 30 September briefing (actually more conservative / 'less scary')
See this thread for why this can change perceptions:
https://twitter.com/Dr_D_Robertson/status/1314328492088193024
Focus on areas with >50 cases per 100,000 - that was ~ the watchlist threshold
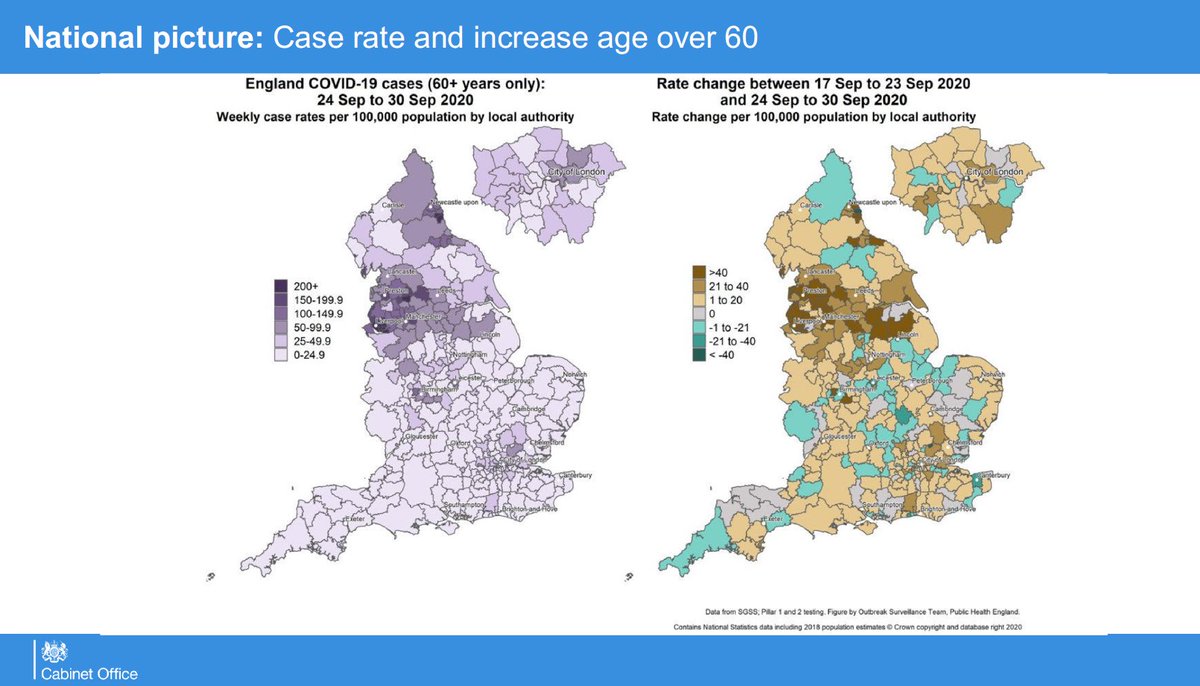
Slide 4
LOOK AT THIS SLIDE
This is a better predictor of where people are going to die. The infection fatality rate scales very heavily with age.
LOOK AT THIS SLIDE
This is a better predictor of where people are going to die. The infection fatality rate scales very heavily with age.
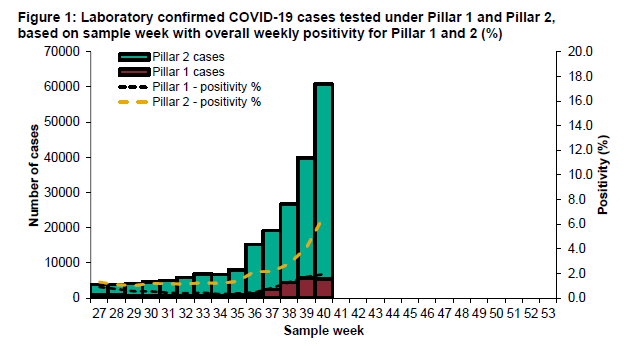
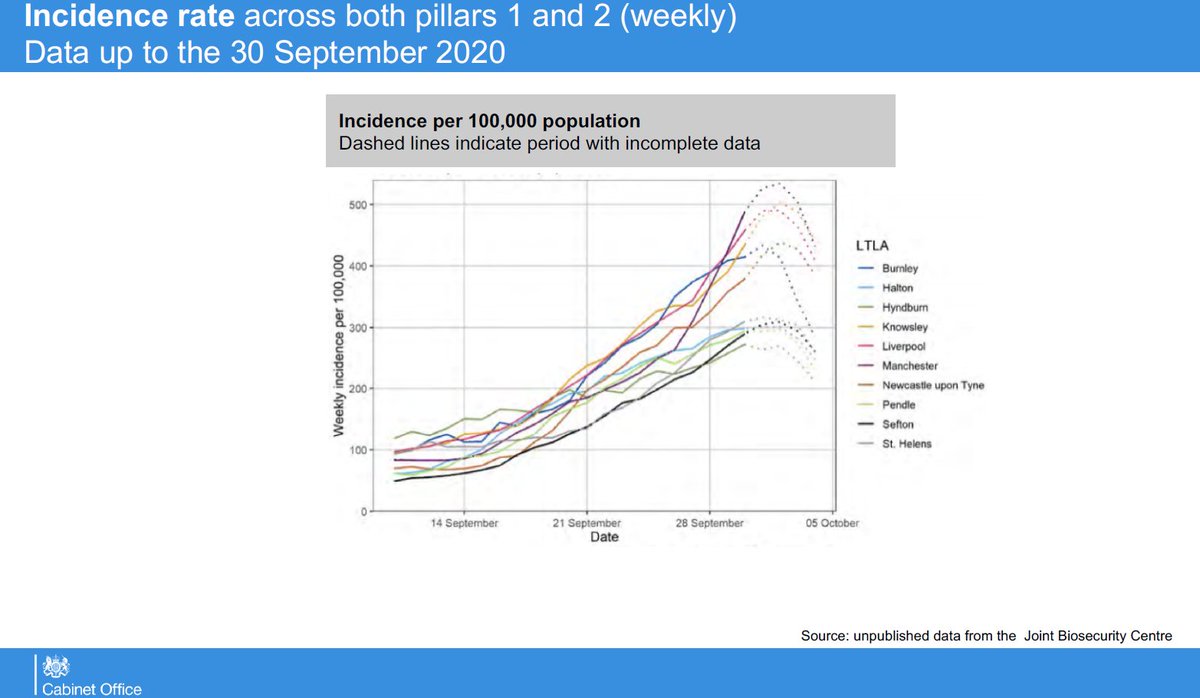
Slide 5
Increasing rapidly. Ask yourself the question why they are dashed lines - this is a delay in getting the test results back.
Increasing rapidly. Ask yourself the question why they are dashed lines - this is a delay in getting the test results back.
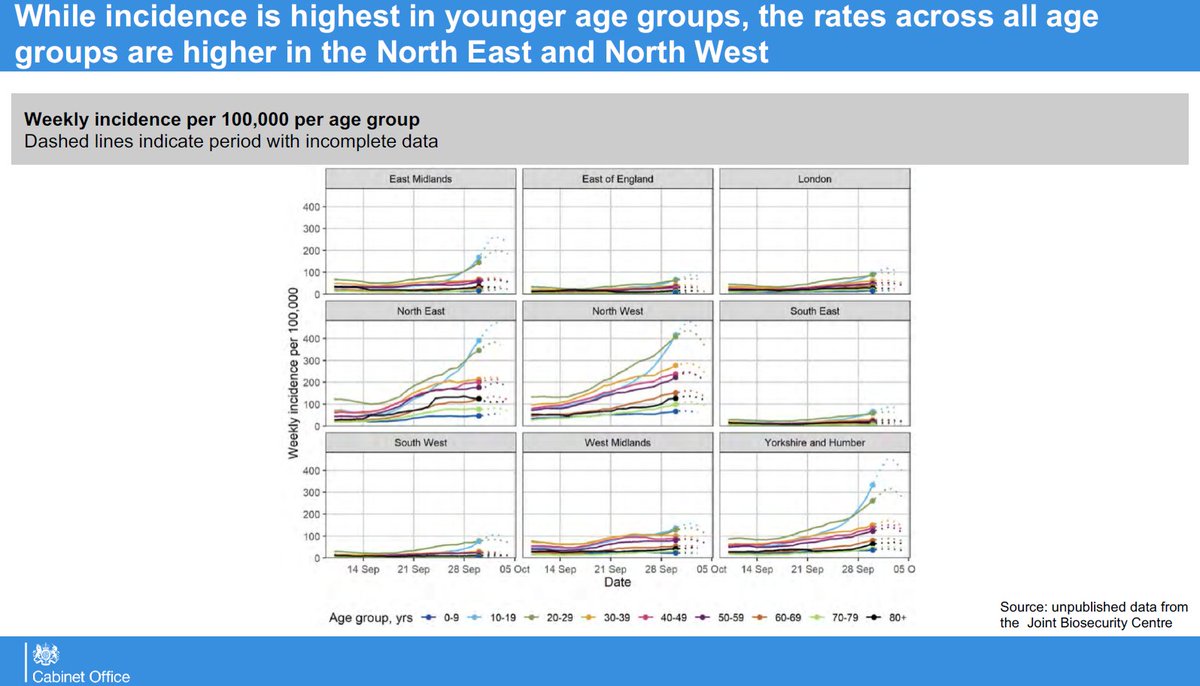
Slide 6
Yes, it is spreading differentially across different regions, but these are precursors for other parts of the country.
Note rapid rise in 10-19 year olds (light blue)
Yes, it is spreading differentially across different regions, but these are precursors for other parts of the country.
Note rapid rise in 10-19 year olds (light blue)
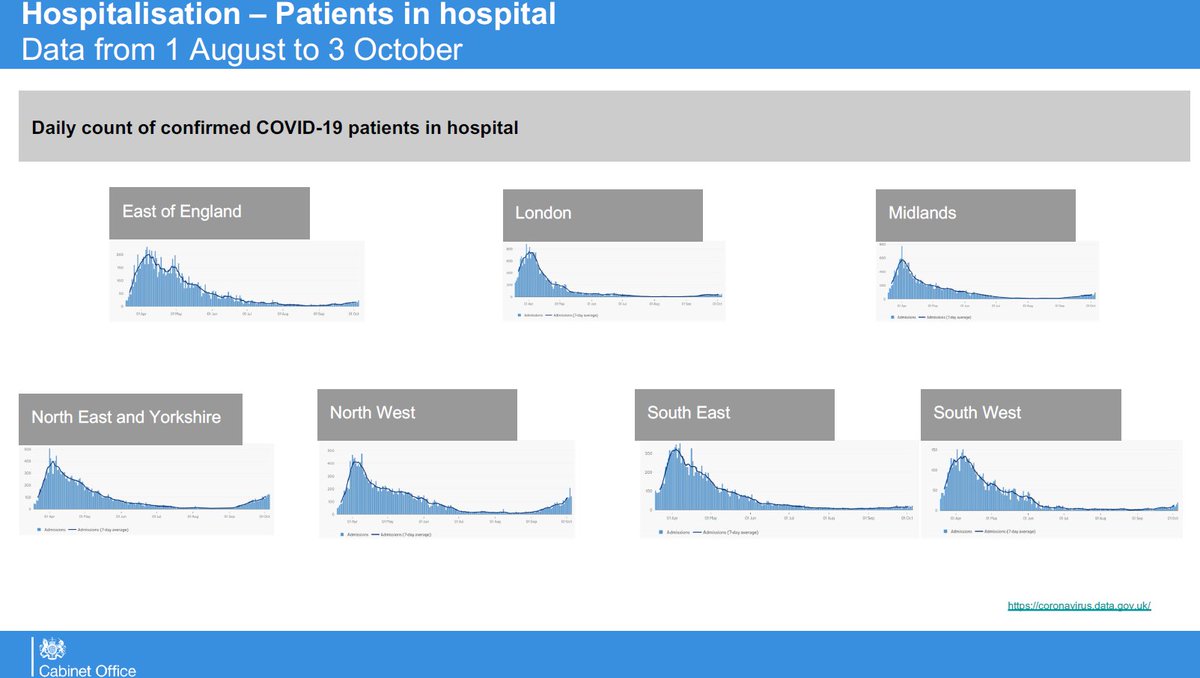
Slide 7
NE & Yorkshire, NW. Ask how many days until capacity reached in hopsitals (and for all regions of the country)
NE & Yorkshire, NW. Ask how many days until capacity reached in hopsitals (and for all regions of the country)
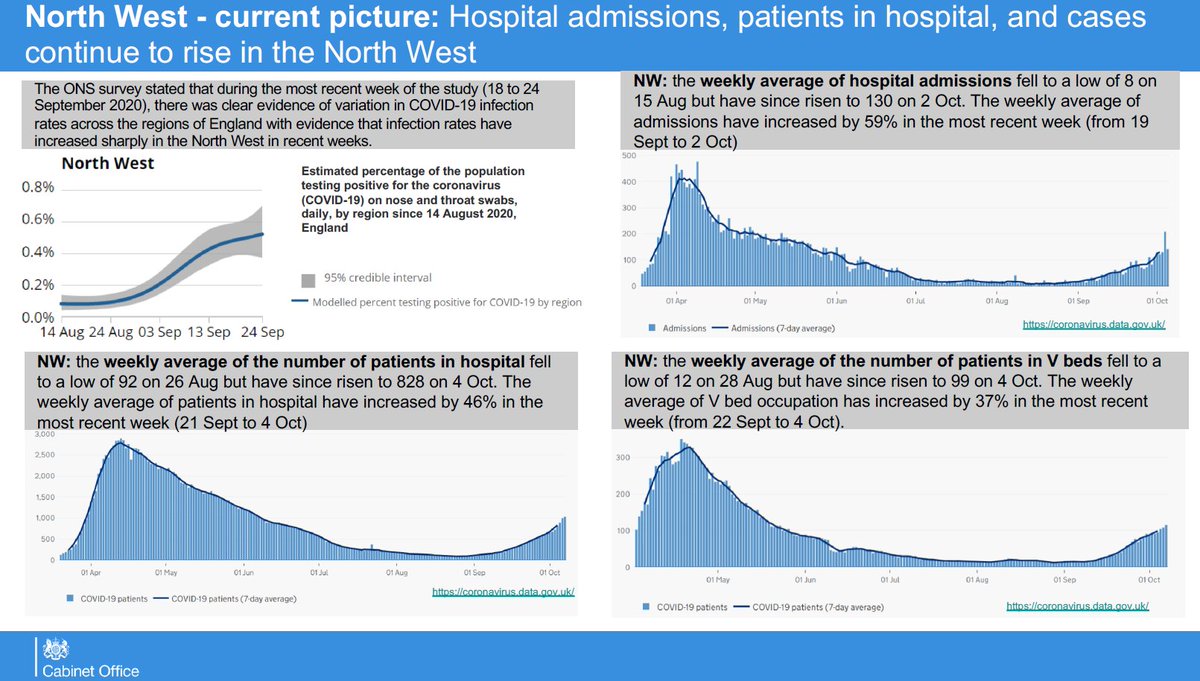
Slide 8-11 go into more detail for NE/Yorks & NW
THIS IS NOT JUST A NORTH PROBLEM
Look at this again
Remember ONS may be underestimating students in halls of residence
THIS IS NOT JUST A NORTH PROBLEM
Look at this again
https://twitter.com/Dr_D_Robertson/status/1314328492088193024and remember ~ 50 cases per 100,000 was the watchlist threshold
Remember ONS may be underestimating students in halls of residence
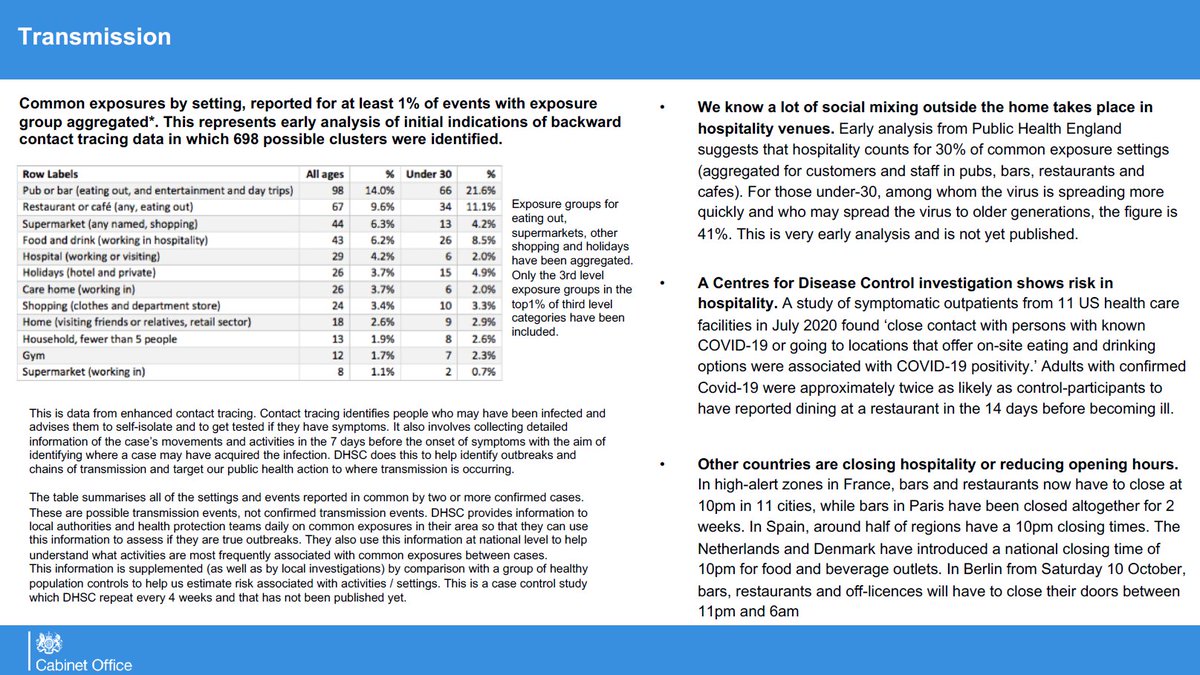
Slide 12
Remember the Chief Scientific Officer / Chief Scientific Adviser briefing on 21 September? That was to tell you that transmission happens by aerosols. That's big news.
Remember the Chief Scientific Officer / Chief Scientific Adviser briefing on 21 September? That was to tell you that transmission happens by aerosols. That's big news.
https://twitter.com/Dr_D_Robertson/status/1308076859452723200
And while we're discussing the Chief Scientific Officer, have a read of this thread. It is the state of 'The Science' on 14 July
It's called "Preparing for a Challenging Winter" and it's available here:
acmedsci.ac.uk/file-download/…
It's called "Preparing for a Challenging Winter" and it's available here:
acmedsci.ac.uk/file-download/…
https://twitter.com/Dr_D_Robertson/status/1306631814849626117
@_RobbieMoore
@AaronBell4NUL
@ab4scambs
@abenaopp
@ABridgen
@AdamAfriyie
@Afzal4Gorton
@AJonesMP
@AlanBrownSNP
@alancampbellmp
@AlanMakMP
@AlbertoCostaMP
@ALewerMBE
@alexburghart
@AlexChalkChelt
@AlexNorrisNN
@alexsobel
@aliciakearns
@AlokSharma_RDG
@AaronBell4NUL
@ab4scambs
@abenaopp
@ABridgen
@AdamAfriyie
@Afzal4Gorton
@AJonesMP
@AlanBrownSNP
@alancampbellmp
@AlanMakMP
@AlbertoCostaMP
@ALewerMBE
@alexburghart
@AlexChalkChelt
@AlexNorrisNN
@alexsobel
@aliciakearns
@AlokSharma_RDG
@AlunCairns
@AlynSmith
@amandamilling
@andreajenkyns
@andrealeadsom
@AndrewBowie_MP
@AndrewSelous
@angelaeagle
@AngelaRayner
@AnnaMcMorrin
@annietrev
@antony_hig
@ApsanaBegumMP
@ashfield_lee
@ASollowayUK
@AWMurrison
@AylesburyTories
@Bambos_MP
@BarryGardiner
@AlynSmith
@amandamilling
@andreajenkyns
@andrealeadsom
@AndrewBowie_MP
@AndrewSelous
@angelaeagle
@AngelaRayner
@AnnaMcMorrin
@annietrev
@antony_hig
@ApsanaBegumMP
@ashfield_lee
@ASollowayUK
@AWMurrison
@AylesburyTories
@Bambos_MP
@BarryGardiner
@BarrySheerman
@baynes_simon
@BBradley_Mans
@Ben_Everitt
@BenMLake
@BenPBradshaw
@bernardjenkin
@BethWinterMP
@bhatti_saqib
@Bill_Esterson
@BillCashMP
@BimAfolami
@BlaenauGwentMP
@BobBlackman
@BorisJohnson
@BrandonLewis
@BrineMP
@BWallaceMP
@cajardineMP
@baynes_simon
@BBradley_Mans
@Ben_Everitt
@BenMLake
@BenPBradshaw
@bernardjenkin
@BethWinterMP
@bhatti_saqib
@Bill_Esterson
@BillCashMP
@BimAfolami
@BlaenauGwentMP
@BobBlackman
@BorisJohnson
@BrandonLewis
@BrineMP
@BWallaceMP
@cajardineMP
@carlalockhart
@CarolineLucas
@carolinenokes
@CatSmithMP
@CGreenUK
@CherylGillan
@chhcalling
@ChiOnwurah
@Chris_EvansMP
@ChrisLawSNP
@chrisloder
@cj_dinenage
@ClaireHanna
@ClaudiaWebbe
@CliveEfford
@cmackinlay
@CMonaghanSNP
@columeastwood
@ConorBurnsUK
@CarolineLucas
@carolinenokes
@CatSmithMP
@CGreenUK
@CherylGillan
@chhcalling
@ChiOnwurah
@Chris_EvansMP
@ChrisLawSNP
@chrisloder
@cj_dinenage
@ClaireHanna
@ClaudiaWebbe
@CliveEfford
@cmackinlay
@CMonaghanSNP
@columeastwood
@ConorBurnsUK
@ConorMcGinn
@coyleneil
@CPhilpOfficial
@CPJElmore
@craig4monty
@craig4nwarks
@CrispinBlunt
@CSkidmoreUK
@DamianGreen
@DamianHinds
@DanCardenMP
@DanJarvisMP
@danny__kruger
@darrenpjones
@DaveDooganSNP
@david_duguid
@david4wantage
@DavidDavisMP
@DavidJonesMP
@coyleneil
@CPhilpOfficial
@CPJElmore
@craig4monty
@craig4nwarks
@CrispinBlunt
@CSkidmoreUK
@DamianGreen
@DamianHinds
@DanCardenMP
@DanJarvisMP
@danny__kruger
@darrenpjones
@DaveDooganSNP
@david_duguid
@david4wantage
@DavidDavisMP
@DavidJonesMP
@DavidLammy
@DavidLinden
@davidmorrisml
@DavidRutley
@dean4watford
@DeidreBrock
@DerekThomasUK
@DerekTwiggMP
@Dines4Dales
@DJWarburton
@DominicRaab
@Douglas4Moray
@DrBenSpencer
@drewhendrySNP
@drlukeevans
@DrNeilHudson
@DrRosena
@DSimmonds_RNP
@Dunne4Ludlow
@DavidLinden
@davidmorrisml
@DavidRutley
@dean4watford
@DeidreBrock
@DerekThomasUK
@DerekTwiggMP
@Dines4Dales
@DJWarburton
@DominicRaab
@Douglas4Moray
@DrBenSpencer
@drewhendrySNP
@drlukeevans
@DrNeilHudson
@DrRosena
@DSimmonds_RNP
@Dunne4Ludlow
@eastantrimmp
@Ed_Miliband
@EddieHughes4WN
@EdwardJDavey
@EdwardLeighMP
@edwardtimpson
@elliereeves
@ElliotColburn
@EmmaHardyMP
@EstherMcVey1
@FeryalClark
@FlickD
@FloEshalomi
@gaganmohindra
@GarethBaconMP
@Geoffrey_Cox
@Gibbo4Darlo
@gildernewm
@GilesWatling
@Ed_Miliband
@EddieHughes4WN
@EdwardJDavey
@EdwardLeighMP
@edwardtimpson
@elliereeves
@ElliotColburn
@EmmaHardyMP
@EstherMcVey1
@FeryalClark
@FlickD
@FloEshalomi
@gaganmohindra
@GarethBaconMP
@Geoffrey_Cox
@Gibbo4Darlo
@gildernewm
@GilesWatling
@GillFurnissMP
@GillianKeegan
@GlindonMary
@GradySNP
@grahamstuart
@grantshapps
@GregClarkMP
@GregHands
@GregKnight
@gregsmith_uk
@griffitha
@GRobinsonDUP
@GuyOpperman
@GwynneMP
@HackneyAbbott
@hbaldwin
@Helen_Whately
@HelenGrantMP
@helenhayes_
@HenrySmithUK
@GillianKeegan
@GlindonMary
@GradySNP
@grahamstuart
@grantshapps
@GregClarkMP
@GregHands
@GregKnight
@gregsmith_uk
@griffitha
@GRobinsonDUP
@GuyOpperman
@GwynneMP
@HackneyAbbott
@hbaldwin
@Helen_Whately
@HelenGrantMP
@helenhayes_
@HenrySmithUK
@hilarybennmp
@HollyLynch5
@HuwMerriman
@iainastewart
@IanByrneMP
@IanLaveryMP
@IanMearnsMP
@IanMurrayMP
@IoWBobSeely
@JackDromeyMP
@JackieDP
@JackLopresti
@JacobYoungMP
@JakeBerry
@JamesDalyMP
@JamesDavies
@JamesMorris
@jamesowild
@JamesSunderl
@Jamie4North
@HollyLynch5
@HuwMerriman
@iainastewart
@IanByrneMP
@IanLaveryMP
@IanMearnsMP
@IanMurrayMP
@IoWBobSeely
@JackDromeyMP
@JackieDP
@JackLopresti
@JacobYoungMP
@JakeBerry
@JamesDalyMP
@JamesDavies
@JamesMorris
@jamesowild
@JamesSunderl
@Jamie4North
@JaneMHunt
@JanetDaby
@JDjanogly
@JeffSmithetc
@Jeremy_Hunt
@jeremycorbyn
@JeromeMayhew
@Jesse_Norman
@jessphillips
@JGray
@JHowellUK
@JimfromOldham
@JimShannonMP
@JNHanvey
@Jochurchill4
@jogideon
@John2Win
@JohnCryerMP
@johnfinucane
@JohnGlenUK
@JanetDaby
@JDjanogly
@JeffSmithetc
@Jeremy_Hunt
@jeremycorbyn
@JeromeMayhew
@Jesse_Norman
@jessphillips
@JGray
@JHowellUK
@JimfromOldham
@JimShannonMP
@JNHanvey
@Jochurchill4
@jogideon
@John2Win
@JohnCryerMP
@johnfinucane
@JohnGlenUK
@JohnHealey_MP
@johnredwood
@jon_trickett
@JonAshworth
@JonathanLord
@JonCruddas_1
@JonesyFay
@joymorrissey
@jreynoldsMP
@JSHeappey
@JuliaLopezMP
@JulianSmithUK
@JulianSturdy
@JulieMarsonMP
@KarenPBuckMP
@karinsmyth
@KarlTurnerMP
@KateGreenSU
@KateOsamor
@johnredwood
@jon_trickett
@JonAshworth
@JonathanLord
@JonCruddas_1
@JonesyFay
@joymorrissey
@jreynoldsMP
@JSHeappey
@JuliaLopezMP
@JulianSmithUK
@JulianSturdy
@JulieMarsonMP
@KarenPBuckMP
@karinsmyth
@KarlTurnerMP
@KateGreenSU
@KateOsamor
@KateOsborneMP
@KeeleyMP
@Keir_Starmer
@KemiBadenoch
@KerryMP
@KevanJonesMP
@khalid4PB
@KimJohnsonMP
@KirstySNP
@kitmalthouse
@labourlewis
@LabourSJ
@Laura__Farris
@LaylaMoran
@Lee4NED
@leicesterliz
@LeoDochertyUK
@lia_nici
@liambyrnemp
@LiamFox
@libdemdaisy
@KeeleyMP
@Keir_Starmer
@KemiBadenoch
@KerryMP
@KevanJonesMP
@khalid4PB
@KimJohnsonMP
@KirstySNP
@kitmalthouse
@labourlewis
@LabourSJ
@Laura__Farris
@LaylaMoran
@Lee4NED
@leicesterliz
@LeoDochertyUK
@lia_nici
@liambyrnemp
@LiamFox
@libdemdaisy
@lisanandy
@LizTwistMP
@lloyd_rm
@LouHaigh
@LSRPlaid
@lucyallan
@lucyfrazermp
@LucyMPowell
@LukeHall
@LukePollard
@lynbrownmp
@marcolonghi4dn
@MarcusFysh
@MariaMillerUK
@MarieRimmer
@Mark_J_Harper
@Mark_Spencer
@mark4dewsbury
@MarkPawsey
@MarkTamiMP
@LizTwistMP
@lloyd_rm
@LouHaigh
@LSRPlaid
@lucyallan
@lucyfrazermp
@LucyMPowell
@LukeHall
@LukePollard
@lynbrownmp
@marcolonghi4dn
@MarcusFysh
@MariaMillerUK
@MarieRimmer
@Mark_J_Harper
@Mark_Spencer
@mark4dewsbury
@MarkPawsey
@MarkTamiMP
@MartynDaySNP
@marykfoy
@MattHancock
@MattRodda
@mattwarman
@MattWestern_
@meaglemp
@Meg_HillierMP
@MelJStride
@MhairiBlack
@michaelgove
@MickeyBradySF
@MickWhitleyMP
@MikeHillMP
@mikejwood
@MikeKaneMP
@mimsdavies
@morton_wendy
@MpHendrick
@MPIainDS
@marykfoy
@MattHancock
@MattRodda
@mattwarman
@MattWestern_
@meaglemp
@Meg_HillierMP
@MelJStride
@MhairiBlack
@michaelgove
@MickeyBradySF
@MickWhitleyMP
@MikeHillMP
@mikejwood
@MikeKaneMP
@mimsdavies
@morton_wendy
@MpHendrick
@MPIainDS
@MPritchardUK
@MrAndy_Carter
@mtpennycook
@munirawilson
@nadams
@nadhimzahawi
@NavPMishra
@NazShahBfd
@neil_parish
@NeilDotObrien
@neilgraysnp
@neill_bob
@NiaGriffithMP
@NickGibbUK
@Nicola4WBE
@nigelmills
@nigelmp
@NorwichChloe
@Nus_Ghani
@Offord4Hendon
@MrAndy_Carter
@mtpennycook
@munirawilson
@nadams
@nadhimzahawi
@NavPMishra
@NazShahBfd
@neil_parish
@NeilDotObrien
@neilgraysnp
@neill_bob
@NiaGriffithMP
@NickGibbUK
@Nicola4WBE
@nigelmills
@nigelmp
@NorwichChloe
@Nus_Ghani
@Offord4Hendon
@OliverDowden
@OwenPaterson
@OwenThompson
@patmcfaddenmp
@PaulaBarkerMP
@paulbristow79
@PaulGirvanMP
@PaulHowellMP
@pauljholmes
@PaulMaskeyMP
@PaulMaynardUK
@peter_aldous
@Peter_Dowd
@PeterBoneUK
@PeterGrantMP
@peterkyle
@PeteWishart
@PGibsonSNP
@pow_rebecca
@OwenPaterson
@OwenThompson
@patmcfaddenmp
@PaulaBarkerMP
@paulbristow79
@PaulGirvanMP
@PaulHowellMP
@pauljholmes
@PaulMaskeyMP
@PaulMaynardUK
@peter_aldous
@Peter_Dowd
@PeterBoneUK
@PeterGrantMP
@peterkyle
@PeteWishart
@PGibsonSNP
@pow_rebecca
@PreetKGillMP
@pritipatel
@PutneyFleur
@Q66Suzi
@rach_hopkins
@Rees4Neath
@RhonddaBryant
@RicHolden
@RishiSunak
@RobDelyn
@robertcourts
@robertlargan
@RobertSyms
@ronniecowan
@Royston_Smith
@RupaHuq
@rushanaraali
@RuthCadbury
@RuthEdwardsMP
@RuthNewportWest
@pritipatel
@PutneyFleur
@Q66Suzi
@rach_hopkins
@Rees4Neath
@RhonddaBryant
@RicHolden
@RishiSunak
@RobDelyn
@robertcourts
@robertlargan
@RobertSyms
@ronniecowan
@Royston_Smith
@RupaHuq
@rushanaraali
@RuthCadbury
@RuthEdwardsMP
@RuthNewportWest
@S_Hammond
@sajidjavid
@SallyAnn1066
@SamTarry
@sarahjolney1
@SarahOwen_
@scottmann4NC
@SCrabbPembs
@scullyp
@SDoughtyMP
@SelaineSaxby
@ShaileshVara
@Shaun4WBW
@Simon4NDorset
@SimonClarkeMP
@simonfell
@Simonhartmp
@simonjamesjupp
@Siobhain_Mc
@SirGrahamBrady
@sajidjavid
@SallyAnn1066
@SamTarry
@sarahjolney1
@SarahOwen_
@scottmann4NC
@SCrabbPembs
@scullyp
@SDoughtyMP
@SelaineSaxby
@ShaileshVara
@Shaun4WBW
@Simon4NDorset
@SimonClarkeMP
@simonfell
@Simonhartmp
@simonjamesjupp
@Siobhain_Mc
@SirGrahamBrady
@SirRogerGale
@SKinnock
@spellar
@stellacreasy
@stephenctimms
@steve_mccabe
@SteveBakerHW
@SteveBarclay
@stevedouble
@SteveReedMP
@StuartAndrew
@TahirAliMP
@TaiwoOwatemi
@TanDhesi
@TeamRanil
@ThangamMP
@theodoraclarke
@theresa_may
@SKinnock
@spellar
@stellacreasy
@stephenctimms
@steve_mccabe
@SteveBakerHW
@SteveBarclay
@stevedouble
@SteveReedMP
@StuartAndrew
@TahirAliMP
@TaiwoOwatemi
@TanDhesi
@TeamRanil
@ThangamMP
@theodoraclarke
@theresa_may
@timfarron
@timloughton
@tobyperkinsmp
@Tom_Randall
@tomhunt1988
@TomTugendhat
@tony4rochdale
@tracey_crouch
@TracyBrabin
@trussliz
@TulipSiddiq
@Valerie_VazMP
@vickyford
@VotePursglove
@WayneDavid_MP
@Wera_Hobhouse
@wesstreeting
@William_Wragg
@willquince
@timloughton
@tobyperkinsmp
@Tom_Randall
@tomhunt1988
@TomTugendhat
@tony4rochdale
@tracey_crouch
@TracyBrabin
@trussliz
@TulipSiddiq
@Valerie_VazMP
@vickyford
@VotePursglove
@WayneDavid_MP
@Wera_Hobhouse
@wesstreeting
@William_Wragg
@willquince
• • •
Missing some Tweet in this thread? You can try to
force a refresh