͏@VoidSurf1 wrote a cool thread on Sweden excess deaths over the last few centuries. At first sight, his analysis seems correct... But there is a fatal flaw.

1/n
You can find his analysis here:


2/n
Despite the mortality data for 2020 being preliminary, he took great precautions to make it as accurate as possible. Good👍

Note how it is apparent that the month of April alone had 2000 excess deaths.

3/n
This chart (red annotations are mine) shows excess mortality per year, while ignoring months with below-average mortality. So this shows excess death events that lasted less than a year.

For starters, this shows COVID-19 caused the highest excess mortality since World War 2

4/n
But check out the Y axis... Why does it show only about 600 excess deaths for the period Jun 2019-Jul 2020?

(The title shows Jul-Jun instead of Jun-Jul... probably an error)

We saw above the month of April alone had 2000 excess deaths. So why does the chart show 600?

5/n
This is an error in @VoidSurf1's analysis. His chart appears to fail to ignore months with negative mortality. Therefore COVID excess deaths after March 2020 are hidden, negated by the unusually low mortality of Winter 2019-2020:

6/n
If I find the time, I will re-do his analysis myself. In the mean time, we can only wait for @VoidSurf1 to respond.

7/n
There was a bigger issue with his analysis:


8/n

• • •

Missing some Tweet in this thread? You can try to force a refresh
 

Keep Current with Beͫvͣaͬnͨd

Beͫvͣaͬnͨd Profile picture

Stay in touch and get notified when new unrolls are available from this author!

Read all threads

This Thread may be Removed Anytime!

PDF

Twitter may remove this content at anytime! Save it as PDF for later use!

Try unrolling a thread yourself!

how to unroll video
  1. Follow @ThreadReaderApp to mention us!

  2. From a Twitter thread mention us with a keyword "unroll"
@threadreaderapp unroll

Practice here first or read more on our help page!

More from @zorinaq

24 Oct
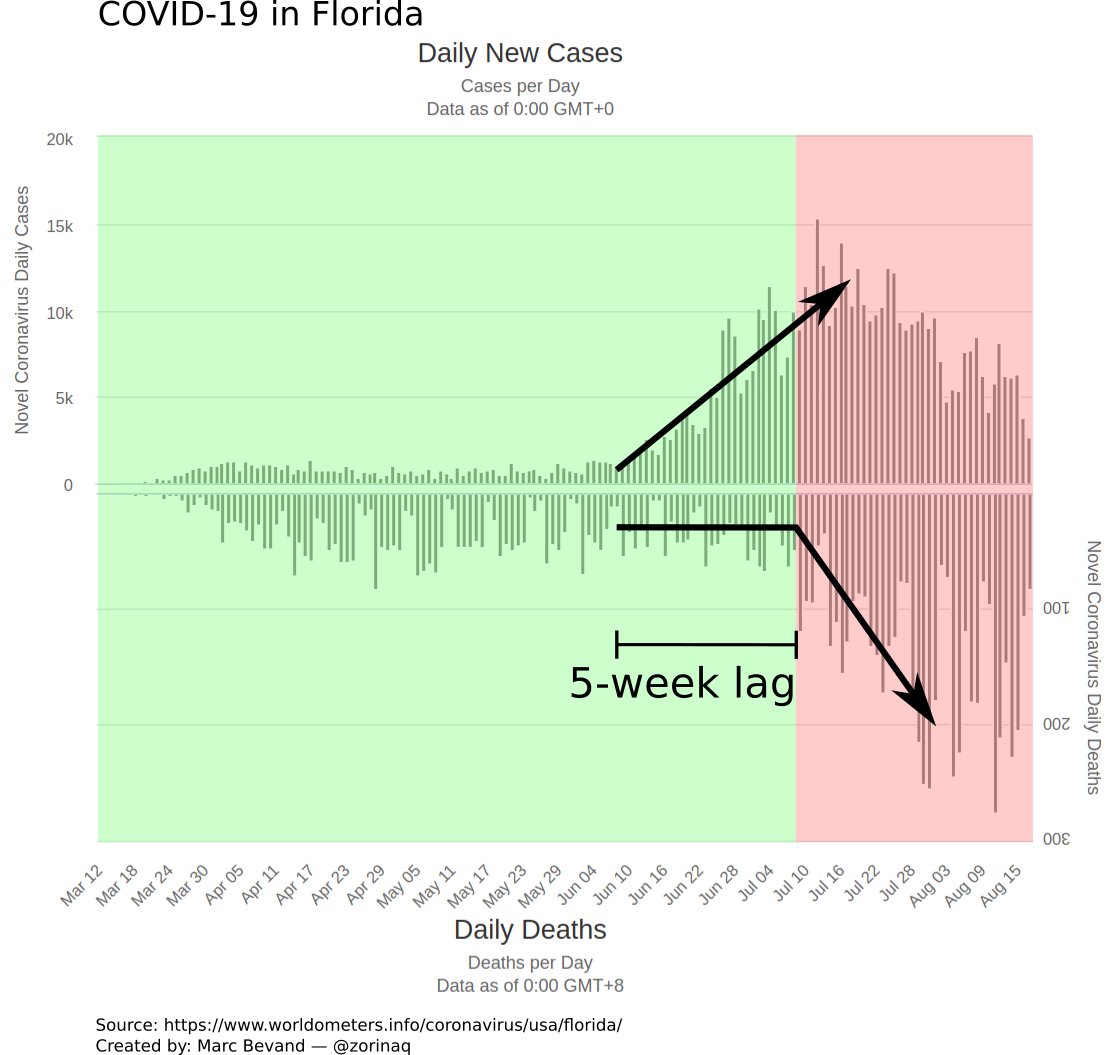
COVID deaths & hospitalizations always lag cases. The lag has been demonstrated, is often 𝗺𝗼𝗿𝗲 than a month, and its timing can be predicted accurately (I have done it.) The #casedemic folks are just, well, wrong.

A thread explaining the lag with real-world examples.

1/n Image
I will show what causes the lag, and how I can predict it accurately. First, there are multiple causes behind it:

#1 clinical
#2 reporting
#3 age prevalence

I will explain these causes one by one

2/n
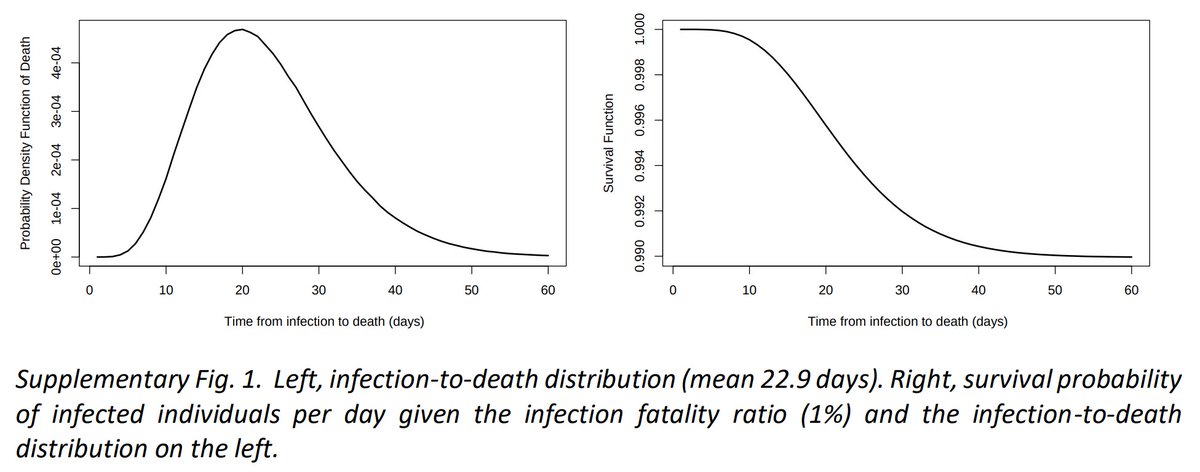
Lag #1 is the most obvious: clinically the mean infection-to-death time is 22.9 days (see pg 4: static-content.springer.com/esm/art%3A10.1…)

So at minimum deaths will lag cases by a little over 3 weeks

Similarly, infection-to-hospitalization is 1-2 weeks

3/n Image
Read 30 tweets
27 Sep
Excited to share this new COVID modeling script:

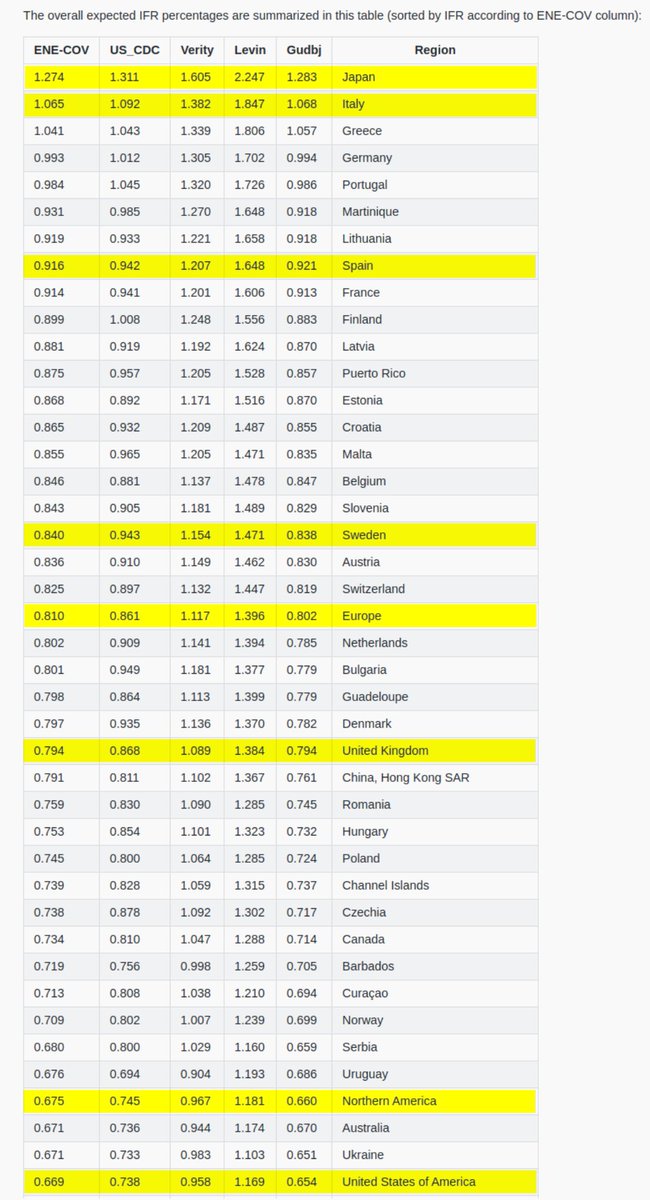
It applies various age-stratified IFR estimates to calculate the expected overall IFR in a given country. It's based on demographics (countries population pyramids): github.com/mbevand/covid1…

Many interesting findings—read on

1/n
First off, I use five different sources estimating the age-stratified Infection Fatality Ratio of COVID-19:

1. ENE-COVID
2. US CDC
3. Verity et al.
4. Levin et al.
5. Gudbjartsson et al.

If you know of more sources, let me know and I'll add them to my script

2/n
So, what do we find?

The overall IFR estimates, with the exception of Levin et al., are relatively consistent with each other, usually within 30-40%. Levin et al. is up to 2-fold higher than the others, depending on the country.

3/n
Read 9 tweets
9 Sep
Observations about Sweden:
• They are far from herd immunity:
• Social distancing is what keeps cases low right now:

So, a #prediction: *if* they relax social distancing too much they will be hit by a second wave of rising cases
Some countries also far from herd immunity have been able to keep cases close to zero thanks to social distancing, mass testing...

South Korea went nearly 6 months without a 2nd wave

Perhaps Sweden will hold out 6 months. We don't know *when* but we know a 2nd wave is possible Image
Covid cases jump +57% in Stockholm county: 526 this week, compared to 334 the week before

"The Stockholm region sees signs that the spread of infection is increasing in the county."

Almost like there's no herd immunity! #WhoCouldHaveGuessed?🤔

dn.se/sthlm/sjukvard… Image
Read 5 tweets
6 Sep
Share of individuals with PCR-confirmed COVID-19 infection who end up with detectable antibodies:

• 91.1% according to Icelandic study nejm.org/doi/full/10.10…
• ~66% according to RKI
• ~85% according to Spain ENE-COVID19 study mscbs.gob.es/ciudadanos/ene…
RKI found the smallest share. It's also the study with the smallest number of infected individuals.

# of infected individuals:
• 3,177 in Icelandic study
• 299 in RKI study (Bad Feilnbach and Kupferzell)
• 63,564 in round 2 of Spain ENE-COVID19 study
Another study sciencedirect.com/science/articl… (only 137 infected) found:

81.1% of outpatients, 15.4% of asymptomatic individuals develop antibodies

We think ~35% of all infections are asymptomatic so the overall share of cases developing antibodies might be:

15.4*.35 + 81.1*.65 = 58%
Read 4 tweets
5 Sep
Beware of this claim:

«A US resident in a Long-Term Care Facility (LTCF) has a median length of stay (LOS) of 5 months until death, so if they die of COVID-19 it's no big deal»

It's false.

1/n
First the definition of LTCF varies by state, but usually is "nursing facilities, assisted living facilities, adult care centers, intermediate care facilities, and/or other long-term care facilities", see kff.org/health-costs/i… (in Notes under Additional State-level Data)

2/n
The claim of a 5-month median LOS comes from this 2010 study: ncbi.nlm.nih.gov/pmc/articles/P…

There are 3 flaws with this claim:

Flaw #1: this study only covers nursing facilities, and excludes all other LTCF such as assisted living facilities, adult care centers, etc

3/n
Read 10 tweets

Did Thread Reader help you today?

Support us! We are indie developers!


This site is made by just two indie developers on a laptop doing marketing, support and development! Read more about the story.

Become a Premium Member ($3/month or $30/year) and get exclusive features!

Become Premium

Too expensive? Make a small donation by buying us coffee ($5) or help with server cost ($10)

Donate via Paypal Become our Patreon

Thank you for your support!

Follow Us on Twitter!