1/2 Since 2004, a candidate has polled at or above 49% in a battleground state and gone on to lose that state once. One time. #ElectionTwitter
Never in recent history (curious if ever?) - has a candidate polled over 50% and lost.
@FiveThirtyEight
@RealClearNews
Never in recent history (curious if ever?) - has a candidate polled over 50% and lost.
@FiveThirtyEight
@RealClearNews

Sidenote before pt 2 (which I think is even crazier than pt 1):
Battleground states are, by definition, supposed to be close.
That doesn't always mean Tossup - it includes many lean blue or lean red states.
HOWEVER.
This is a strong piece of data to show 49%+ is DOMINANT
Battleground states are, by definition, supposed to be close.
That doesn't always mean Tossup - it includes many lean blue or lean red states.
HOWEVER.
This is a strong piece of data to show 49%+ is DOMINANT
2/2
Not only has a candidate only ONCE lost a state since 2004 with a polling avg of 49%+, but also
Only TWICE has a candidate with a polling avg of 49%+ underperformed that poll number:
FL12Romney 49.7 --> 49.1
NV04Bush 51 --> 50.47
@FiveThirtyEight @RealClearNews @Redistrict
Not only has a candidate only ONCE lost a state since 2004 with a polling avg of 49%+, but also
Only TWICE has a candidate with a polling avg of 49%+ underperformed that poll number:
FL12Romney 49.7 --> 49.1
NV04Bush 51 --> 50.47
@FiveThirtyEight @RealClearNews @Redistrict

Say what you will about @RealClearNews polling avgs vs @FiveThirtyEight
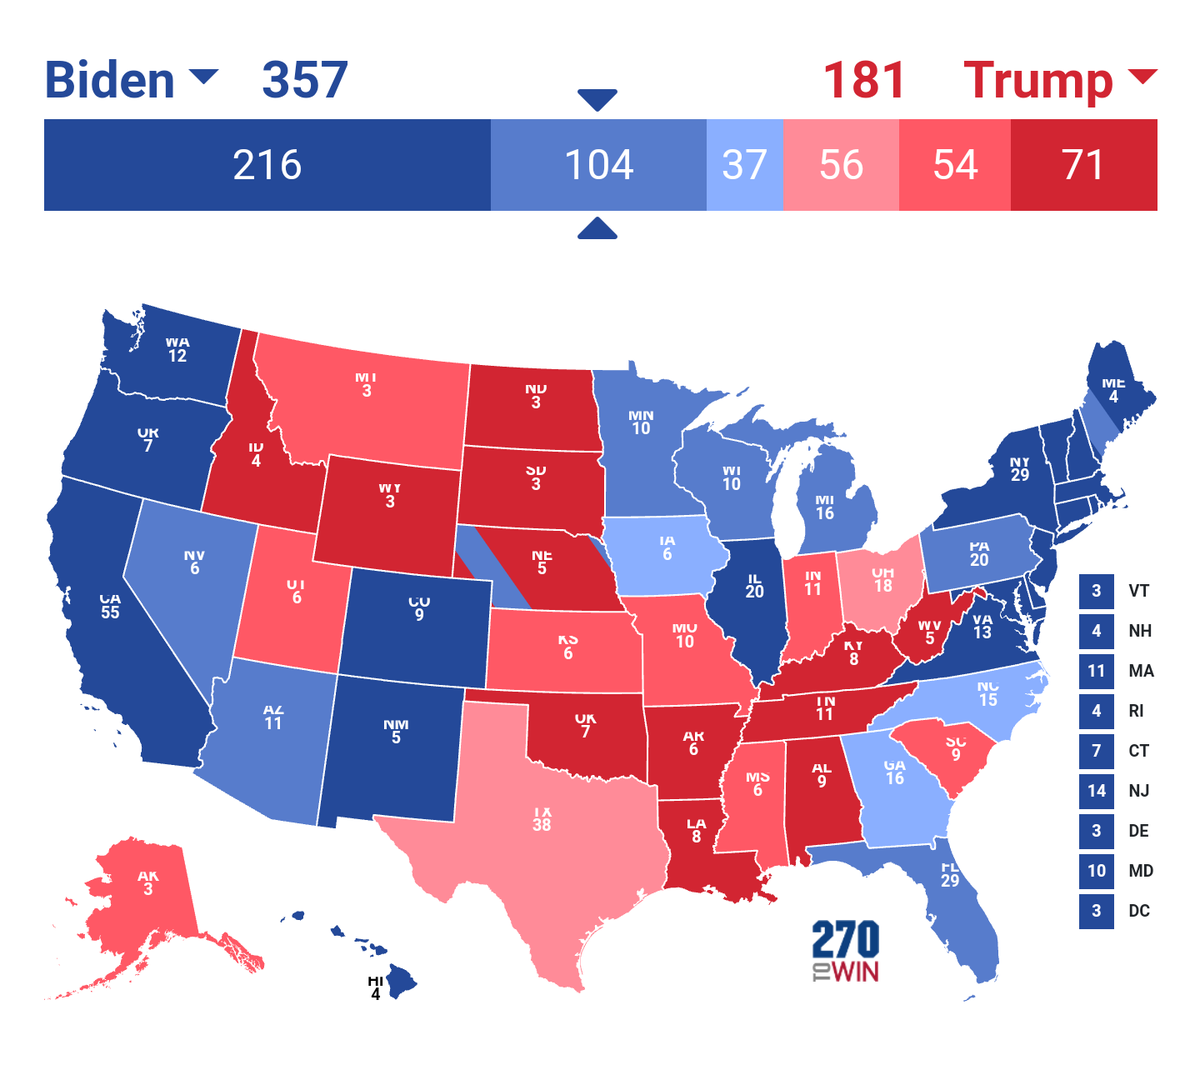
49% isn't just strong, it's dominant. 7 days to #Election2020 & RCP has Biden 49%+ in:
PA (49.6%)
WI (49.8%)
MI (50.5%)
538 even higher. Can Trump win without these? #ElectionTwitter
@SeanTrende @Redistrict
49% isn't just strong, it's dominant. 7 days to #Election2020 & RCP has Biden 49%+ in:
PA (49.6%)
WI (49.8%)
MI (50.5%)
538 even higher. Can Trump win without these? #ElectionTwitter
@SeanTrende @Redistrict
Candidates who poll 49%+ win
For @FiveThirtyEight's obsession with "poll error" as they wrongly define it (poll margin minus election margin) - have they done *any* research into candidate's actual poll numbers?
Seems important to understand that the "error" seems to go one way
For @FiveThirtyEight's obsession with "poll error" as they wrongly define it (poll margin minus election margin) - have they done *any* research into candidate's actual poll numbers?
Seems important to understand that the "error" seems to go one way

E.g. just yesterday 538 tweeted this dumb shit:
"In 2 of the past 10 elections, there's been a 5+ point swing between polls now and final result.
* Assume a 50/50 chance such a swing would favor Trump."
Why assume something you can test @NateSilver538?
"In 2 of the past 10 elections, there's been a 5+ point swing between polls now and final result.
* Assume a 50/50 chance such a swing would favor Trump."
Why assume something you can test @NateSilver538?
https://twitter.com/NateSilver538/status/1320792383693488128?s=19
How many times has a candidate polled at 49%+ and lost? Shit, how many times have they even finished below 49%?
@NateSilver538 has this flawed reasoning that I've been pointing out for months - that poll margin isn't the great metric he thinks. Why?
50-45 isn't the same as 45-40
@NateSilver538 has this flawed reasoning that I've been pointing out for months - that poll margin isn't the great metric he thinks. Why?
50-45 isn't the same as 45-40

You know what this data tells me?
Candidates who poll well tend to do *better* than their polls
@NateSilver538's flawed "margin" metric says if a candidate polls 50-45 & wins 55-45, "pOLLs OfF bY 5!" Then, for some reason, assumes this "error" is equally likely to go both ways.
Candidates who poll well tend to do *better* than their polls
@NateSilver538's flawed "margin" metric says if a candidate polls 50-45 & wins 55-45, "pOLLs OfF bY 5!" Then, for some reason, assumes this "error" is equally likely to go both ways.

Since 2004, candidates polling at 49%+ have OUTPERFORMED their poll number by an avg of 2.4%
In battleground states alone, they've outperformed that number 27/29 times
It gets better. Those 2 underperformances? A whopping 0.6 & 0.53
@RealClearNews @Redistrict #ElectionTwitter
In battleground states alone, they've outperformed that number 27/29 times
It gets better. Those 2 underperformances? A whopping 0.6 & 0.53
@RealClearNews @Redistrict #ElectionTwitter

So all of this leads to: can we trust the polls?
If you read them right, yes!
The question "what do polls do?" is so commonly misunderstood that even @FiveThirtyEight gets it wrong.
Seriously, don't feel bad.
Here's a thread breaking it down:
If you read them right, yes!
The question "what do polls do?" is so commonly misunderstood that even @FiveThirtyEight gets it wrong.
Seriously, don't feel bad.
Here's a thread breaking it down:
https://twitter.com/RealCarlAllen/status/1316087232806170624?s=19
I messed up the thread because I went to make some dumb joke about paranormal distribution 😂
Let's see if this fixes the thread
Let's see if this fixes the thread
https://twitter.com/RealCarlAllen/status/1321343112153829376?s=19
Adding this to the thread bc people who are *really* into data might dig more.
I build shitty sports betting models for fun and only got into #ElectionTwitter because pandemic.
I am confused at the reality that @FiveThirtyEight doesn't do this math.
I build shitty sports betting models for fun and only got into #ElectionTwitter because pandemic.
I am confused at the reality that @FiveThirtyEight doesn't do this math.
https://twitter.com/RealCarlAllen/status/1321366577963565058?s=19
• • •
Missing some Tweet in this thread? You can try to
force a refresh