Let's take a little review of where we are with UK Covid restrictions.
It wasn't meant to be like this.
A Thread.
With apologies to Nandos.
It wasn't meant to be like this.
A Thread.
With apologies to Nandos.

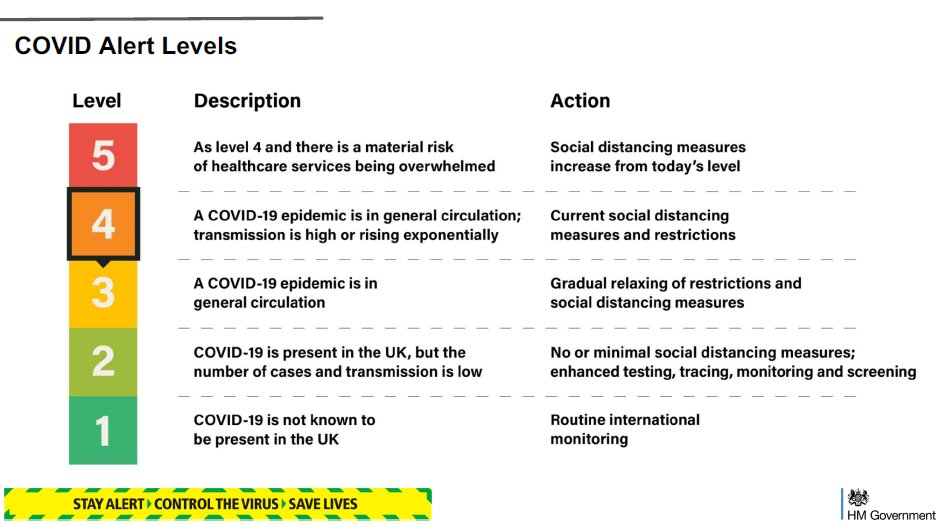
It wasn't meant to be like this. Remember the Alert Levels (the 'Nandos chart')? The whole idea of that was to set some sort of policy - a roadmap if you will - of how we get out of a national lockdown.
Introducing... Covid Alert Levels. 12 May
gov.uk/government/pub…
Introducing... Covid Alert Levels. 12 May
gov.uk/government/pub…
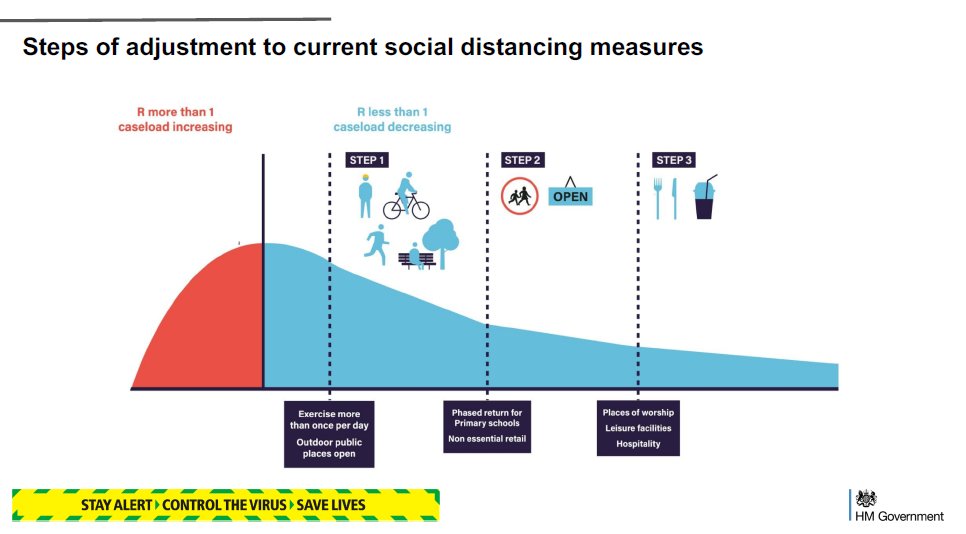
Remember this? The gentle ski slope of calm.
'R less than 1 caseload decreasing'
Ah, simpler times.
'R less than 1 caseload decreasing'
Ah, simpler times.
This was about the same time as the 'science bit'
https://twitter.com/Dr_D_Robertson/status/1259582039533268997
We've also had the shiny new:
- Joint Biosecurity Centre
- National Institute for Health Protection
- The Contain framework
and lots of other things that seem to have been good ideas at the time.
- Joint Biosecurity Centre
- National Institute for Health Protection
- The Contain framework
and lots of other things that seem to have been good ideas at the time.
That Contain framework was a good one. Basically if you get to 50 cases per 100,000 your local authority gets on to a watchlist and restrictions come in.
Leicester took the brunt of this one.
duncanrobertson.com/2020/06/29/exp…
Leicester took the brunt of this one.
duncanrobertson.com/2020/06/29/exp…
Each week, a watchlist was created of the local authorities that were nearing the 50-or-so cases per 100,000 threshold, and they were placed on a list.
New restrictions came into force.
Trafford was Mentioned in Dispatches with only 32 cases per 100,000
New restrictions came into force.
Trafford was Mentioned in Dispatches with only 32 cases per 100,000
https://twitter.com/Dr_D_Robertson/status/1315587177150021633
Of course, experts have been banging on about the reckless way that restrictions were lifted - with no basis in science.
10pm closure times for pubs, that sort of thing.
Of course, SAGE has experts coming out of its ears, who could have advised on this sort of thing
10pm closure times for pubs, that sort of thing.
Of course, SAGE has experts coming out of its ears, who could have advised on this sort of thing
Of course, they *did* advise on this sort of thing.
Here's the warning to the Government from 'The Science' on 14 July (worth a read).
Here's the warning to the Government from 'The Science' on 14 July (worth a read).
https://twitter.com/Dr_D_Robertson/status/1306631814849626117
Despite warnings from the Deputy Chief Medical Officer that releasing restrictions too early will backfire spectacularly, the Government pressed on relasing things.
We were happy, we ate out to help out. We spread the virus.
We were happy, we ate out to help out. We spread the virus.
Turns out that focus groups and popular policies aren't necessarily the best way of doing strategy.
(I wrote about this in the @ft in *March*)
duncanrobertson.com/2020/03/31/cov…
(I wrote about this in the @ft in *March*)
duncanrobertson.com/2020/03/31/cov…
So, the Government came up with a new shiny Tier Level thing. A new Nandos chart, with extra mild and mild removed.
Like the Nandos chart, we start with 'medium'. Sounds lovely. That's most of the country.
Like the Nandos chart, we start with 'medium'. Sounds lovely. That's most of the country.
Problem is that *every single local authority in the country' has a higher than Trafford that managed to get itself on the Contain watchlist.
https://twitter.com/avds/status/1321491300093448193
So, we now have High and Very High Tier levels.
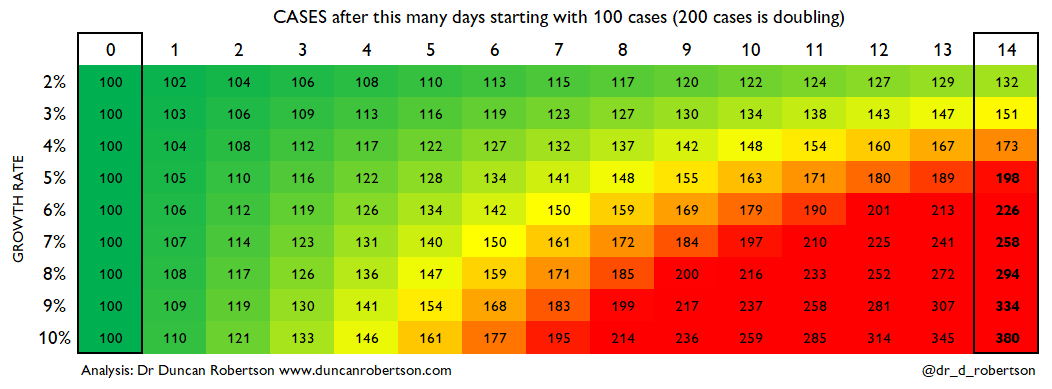
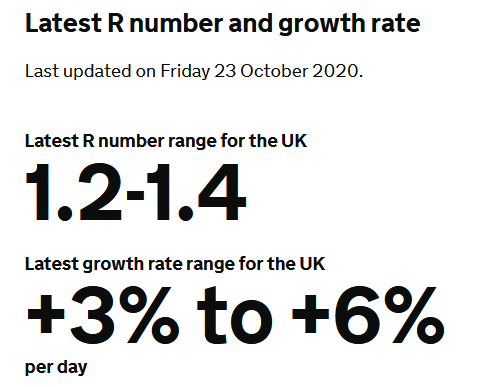
Problem is, of course, that all this procrastination means that the virus is still doubling. If the growth rate is 5%, that means doubling every two weeks.
Problem is, of course, that all this procrastination means that the virus is still doubling. If the growth rate is 5%, that means doubling every two weeks.
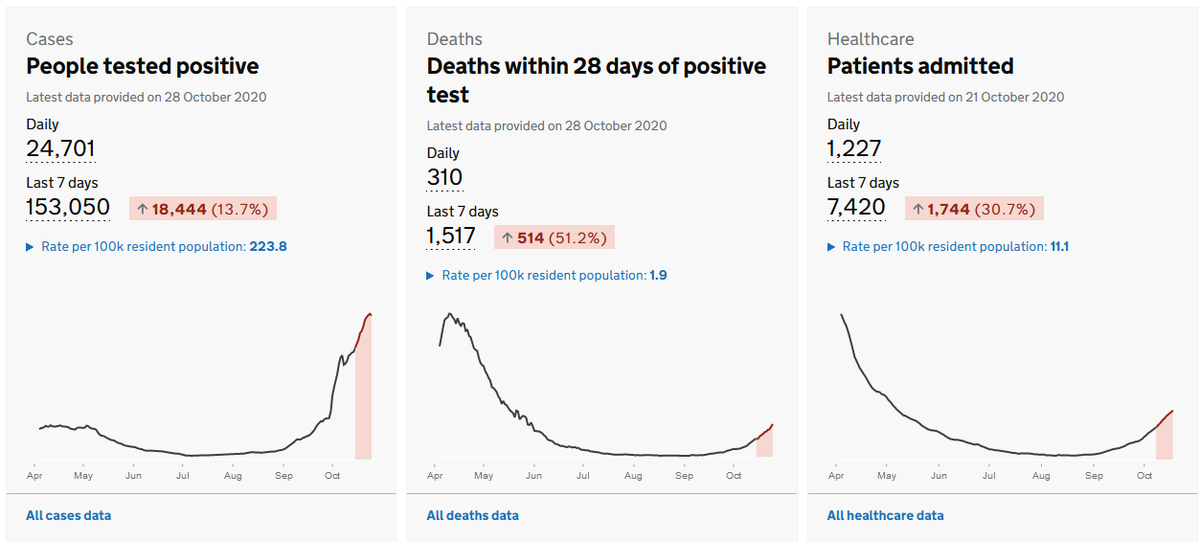
So, we're seeing
- patients admitted to hospital increasing 30% week on week
- deaths increasing 50% week on week
- patients admitted to hospital increasing 30% week on week
- deaths increasing 50% week on week
We're now back to another mess of Very High Tier 3 restrictions, not uniform at all as per the plan, but different depending on where you are.
https://twitter.com/Dr_D_Robertson/status/1318122646375190533
And... we're back to where we started - uncontrolled virus spread with a mess of differing local restrictions.
Maybe we could do some Powerpoints and Blue Sky Thinking and re-invent the Nandos scale and call it the Scoville scale.
Because things are getting extra hot out there.
Maybe we could do some Powerpoints and Blue Sky Thinking and re-invent the Nandos scale and call it the Scoville scale.
Because things are getting extra hot out there.

Here's a link to the article on my website. Added a bit on the failure of Test & Trace for good measure.
duncanrobertson.com/2020/10/28/a-r…
duncanrobertson.com/2020/10/28/a-r…
• • •
Missing some Tweet in this thread? You can try to
force a refresh