@luca_forconi asked me why data from Folkhälsomyndigheten on ICU use in Sweden doesn't match what SIR - the Swedish Intensive Care Registry is reporting. I hadn't previously looked, and he's right!
This is a graph of this month, comparing FHM reports of "# of Intensive Care per day" compared to SIRs "# of individuals admitted with Covid-19" as of the latest data from both.
Some of it seems to be reporting lag, but SIR is reporting 101 individuals, FHM is reporting just 75. I checked the FHM description of data sources and differences, they don't seem to mention ICU admissions, just deaths.
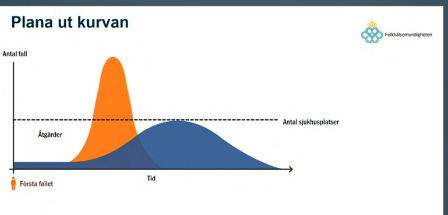
A key graph from Swedish Public Health Authorities press conference today that many may have missed the implications of. The same one was used back in March.
Remember "flatten the curve"? It's back. But there's something important to understand about this graph.
The areas in the graph (orange and blue in this case) represents the total number of people requiring hospitalization. This is a relative stable percentage of the total population, so you could draw a smaller, bigger, graph to reflect infections, with much the same shapes.
In the first instance (orange), hospitalisation needs increase rapidly, and then begins to decline. This reflects community infection spreading rapidly, and then declining.
3 254 new #coronasweden cases announced today, taking Tuesday's total to 2416 and yesterday to 2820. The last data data is nearly always updated next day by approximately 25%, so we've almost certainly blown way past 3000 new cases in one day.
7 new deaths also registered, bringing the total to 5934. Despite nearly 200 deaths being removed through "adjustments" in recent weeks, this is a new high.
Oldest change +1 to October 10. Number of deaths with an unregistered data is now up to 9.
Swedish Palliative Care registry reports 122 Covid deaths for October, compared to FHMs total of 72. That's an increase of *14* since Tuesday.
As I reported likely last week, the #covid19 Sweden death toll today *decreased* by 15. In reality, there were (at least) 16 deaths added, all since October 12, and at least 31 deaths removed, from May to August.
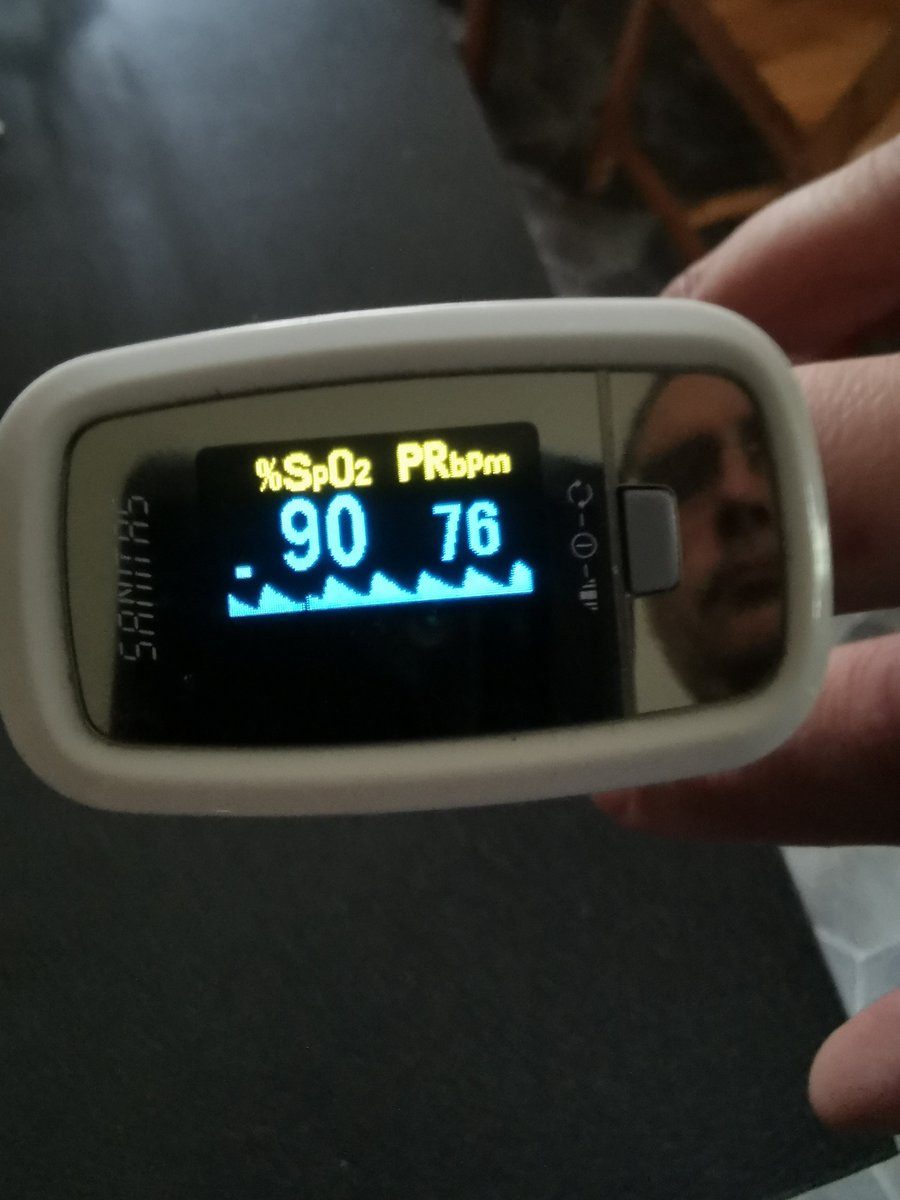
For those who think a Swedish "second wave" is only about how many people are hospitalized or dying. This is till happening to me, now almost 7 MONTHS after I first fell ill. Left is from Sept 22, right is right now.
Most of the time is good now, >97 but this is still regular
That's my blood oxygen levels dipping under 94, the "safe" level. At my worst it went in to the 80s. I bought the pulseoximeter a couple of years ago out of curiosity, prior to Covid I had never seen it drop below 97. I bought a second to confirm it was correct. It is.
ZERO health issues before covid apart from some mild allergies. I was very fit, resting pulse rate in the mid to low 50s, training 5-7 times a week and training others
Sweden is now having thousands of people a week testing postive for covid. How many are going to be #longcovid?
I only recently discovered the Swedish Palliative Care Registry and have started to compare it's data to Folkhälsomyndigheten, and there are some significant differences.
FHM unfortunately doesn't provide breakdown of deaths by age by date, but they do provide cumulative totals by 10 year age groups, eg 70-79 yr olds.
The palliative care registry does the same, but unfortunately using a different range, eg 75-85 🤨
If I take FHM's reports of total deaths from 60yrs and up reported today, and subtract the same figure reported on Sept 1, I get 72 deaths so far registered in September
If I take the 65 and up age group from SPR (a smaller group) I get 103 deaths.
Irish interview with Johan Giesecke. Interviewer @boucherhayes seems to have a solid grasp of epidemiological confounders, and Giesecke denies giving advice (paid?) and admits he spoke without any research into local conditions.