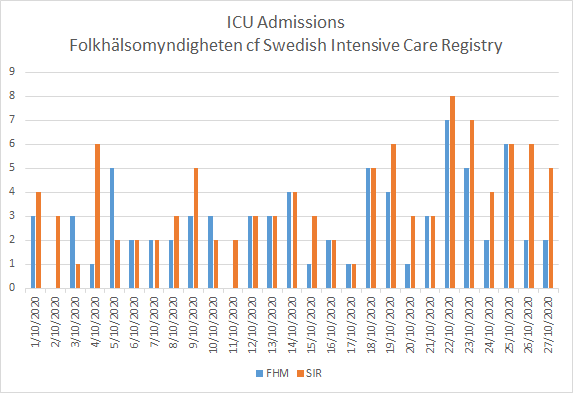
A key graph from Swedish Public Health Authorities press conference today that many may have missed the implications of. The same one was used back in March.
Remember "flatten the curve"? It's back. But there's something important to understand about this graph.
Remember "flatten the curve"? It's back. But there's something important to understand about this graph.

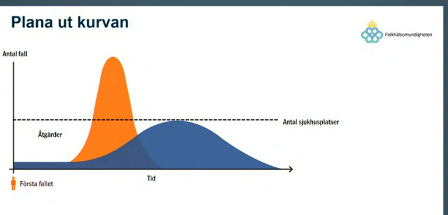
The areas in the graph (orange and blue in this case) represents the total number of people requiring hospitalization. This is a relative stable percentage of the total population, so you could draw a smaller, bigger, graph to reflect infections, with much the same shapes.
In the first instance (orange), hospitalisation needs increase rapidly, and then begins to decline. This reflects community infection spreading rapidly, and then declining.
In the blue curve, *the same number of people are hospitalised* - and thus the same number infected, but they're just spread out over time.
So why do the numbers decline? What causes a steady decline in hospitalisations, and thus deaths, like this?
So why do the numbers decline? What causes a steady decline in hospitalisations, and thus deaths, like this?
The answer is that, from epidemiological modelling, the number of "susceptible" has declined. There's fewer people who can get infected. Why? Because they've already been infected and are assumed immune. They won't get infected again. (An assumption we now know to be false)
The number of new daily infections decreases until the virus can't find anyone left to infect, since enough people are immune. You may have heard a term describe this. It's called "herd immunity".
This is what Tegnell talks about when he says the strategy isn't "herd immunity", it just happens anyway, a side effect.
The *only* strategy here is to slow down the rate of infection so that healthcare isn't overwhelmed.
That's it, that's the Swedish strategy.
The *only* strategy here is to slow down the rate of infection so that healthcare isn't overwhelmed.
That's it, that's the Swedish strategy.
**But the same number of people get infected**, and around 1 in 200 die, and millions get ill, many with long term side effects That's the other side effect he doesn't talk about. It's what we've learned in the 7 months since March.
The fact Folkhälsomyndigheten shows this graph again shows they *still* believe this virus cannot be stopped until we reach "natural" herd immunity. Just slow down infections, protect healthcare.
Look at it again. That blue graph represents 60-70% of Sweden getting infected by sars-cov-2. That's what the Swedish Public Health Authority showed in March, and what they showed again today. It's what they *expect* to happen.
That, in essence, means Tegnell and the Swedish Public Health Authority are *still* operating under a strategy that results in 60-70% of the community getting ill. 0.6% of them dying, and as many as 10-15% suffering the result of #longcovid.
Experience in many other countries, including our close neighbours like Norway, shows this virus *can* be suppressed successfully with brief, sharp national lockdowns, and then regional responses to control outbreaks.
@tomaspueyo famously dubbed this The Hammer and the Dance way back in March. Back then it was theory, a proposal. Today it's been proven to work, and it saves lives.
medium.com/@tomaspueyo/co…
medium.com/@tomaspueyo/co…
Heck, the **Swedish** experience shows it works! Tegnell and his colleagues constantly expressed surprise when serology testing kept finding that not as many people had been infected as they expected.
Emergency healthcare such as tent hospitals were constructed and never used.
Emergency healthcare such as tent hospitals were constructed and never used.
Why? Because the interventions Sweden put in place, along with people's own natural behaviour change, dramatically slowed the spread of the virus - albeit more slowly than our neighbours.
Even here in Sweden, with "virtual lockdown" as Tegnell recently called it, the virus proved amenable to the NPI. Then summer came and we discovered that, yes, this virus is seasonal. It doesn't like summers, it doesn't like outdoors. We could have used a hammer and crushed it
But we didn't then. We still can now, it's not too late. But Folkhälsomyndigheten doesn't want to. This is their strategy - look at again -

It's herd immunity. They showed us it in March, and despite 7 months of new knowledge, and the experience of countries around the world, and even Sweden, they showed it again.
Protect healthcare, slow it down, but let the virus spread. Let people get it. Let people get #longcovid. Let children get MIS-C. Let people die.
That's the strategy, It's in their actions, it's in their modelling. Look at what people DO, not what they SAY.
/end
That's the strategy, It's in their actions, it's in their modelling. Look at what people DO, not what they SAY.
/end
• • •
Missing some Tweet in this thread? You can try to
force a refresh