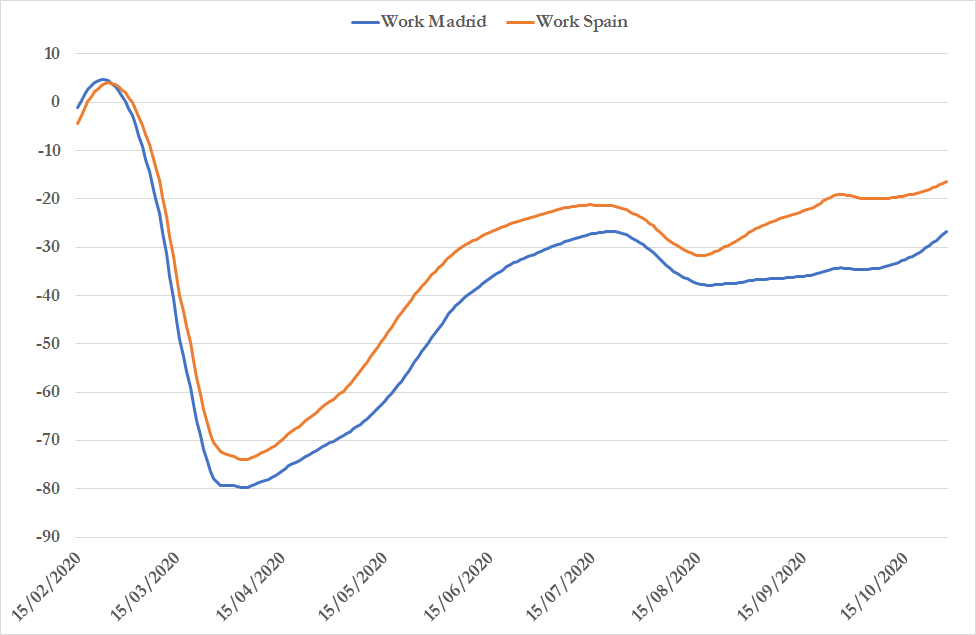
This chart is really intriguing.
It looks like:
1) Around mid-September the rising trend reversed in Spain
2) Around mid-October, Madrid diverged from the rest of the country.
Can we explain this with mobility data?
Time at work indeed suggests a different trend for Madrid and the rest of Spain since mid-august (presumably more office work in Madrid that can be done from home?)
But the change is not October
Slight difference in time spent at home, especially as of mid September ; but hard to see the explanation there
Transit looks like the best explanation : end of September (which is consistent with the 10 day kind of lag expected for measures to kick in) one can see a divergence between Madrid & rest of Spain - which suggests this is more important
But to be honest, none of this looks like a clear explanation for such a difference - which means (& I think that's what is important here) that targeted measures can work, not only massive "stay at home" orders.
I forgot retail, where you can't see any real difference apart from the holiday season & subsequent catchup!

• • •

Missing some Tweet in this thread? You can try to force a refresh
 

Keep Current with JohannesBorgen

JohannesBorgen Profile picture

Stay in touch and get notified when new unrolls are available from this author!

Read all threads

This Thread may be Removed Anytime!

PDF

Twitter may remove this content at anytime! Save it as PDF for later use!

Try unrolling a thread yourself!

how to unroll video
  1. Follow @ThreadReaderApp to mention us!

  2. From a Twitter thread mention us with a keyword "unroll"
@threadreaderapp unroll

Practice here first or read more on our help page!

More from @jeuasommenulle

31 Oct
I don't know if this is hilarious, scary, or just nuts.
Can you spot the exact day when president Macron announced #Lockdown2 & everyone fled Paris like a plagued city in the Middle Ages?
that's a jump from 81 to 117 in just one day, something that never happened in the data, even during #lockdown1 or when it ended. (Daily changes YTD)
And let's face it, people in Marseille are not too keen about staying there either
Read 4 tweets
30 Oct
An Italian drama could unfold in the next few weeks, with substantial consequences. And, again and again, it's about the (probably not) oldest bank in the world, Monte dei Paschi. What is it about? A quick thread
It all started to unfold when the former CEO & Chairman were convicted earlier this month for accounting fraud (related to the infamous Alexandria etc transactions, worth a thread on their own - btw check who was governor at the BoI back then).
The bank is not directly liable for the conviction of the former CEO & Chairman, but there are many litigations ongoing against Monte Paschi & some of them are related to the capital increases that happened back in the time.
Read 11 tweets
30 Oct
Enough Covid, let's move back to banks. The Spanish CB published a great Financial Stability Report with extremely interesting data - very useful as we approach a possibly new lockdown. A thread.
There is a lot about corporate weaknesses due to Covid - we've all heard about it, so I'll just mention this graph.

Blue is pre-Covid, red & orange are baseline and bad macro scenarios.

In hospi/leisure weak forms employ 70% of the total employment of the sector. Really grim.
The BoS has an interesting model to explain who takes loan moratorium. The bad news is that there is a strong skew towards lower quintiles of revenues etc.

This is not very encouraging for when payment holidays stop
Read 14 tweets
29 Oct
J'étaie un peu plus mon thread sur les mensonges de l'allocution du président hier. Allez, c'est parti, on les prend un par un!
"Et si les efforts consentis ont été utiles"
Mensonge #1 : R a été stable autour de 1.2 depuis 3 mois
"Le virus circule en France à une vitesse que même les prévisions les plus pessimistes n’avaient pas anticipé".

#2 - Quelle farce. Je ne compte plus les prévisions plus pessimistes, à commencer par la mienne
Read 22 tweets
29 Oct
How long are we going to stay in Lockdown? Macron said at least early December but that doesn't mean anything. More important he said the metric was going down to 5000 cases a day. When will that be? A quick thread to estimate the lockdown duration.
My first estimate is highly scientific: the first lockdown was 2 months, assuming the handling of the disease is a bit better but we started the lockdown a bit later and it's winter soon, 2 months sounds like a decent benchmark again.
The second estimate: let's reverse the incidence curve and see when we were at 5K. The incidence curve is so horrible now that it's hard to see the number, but 5k was basically the end of august, so 2 months again
Read 5 tweets
28 Oct
Two lies from macron in less than 1 minutes
Minute*
5 lies
Read 13 tweets

Did Thread Reader help you today?

Support us! We are indie developers!


This site is made by just two indie developers on a laptop doing marketing, support and development! Read more about the story.

Become a Premium Member ($3/month or $30/year) and get exclusive features!

Become Premium

Too expensive? Make a small donation by buying us coffee ($5) or help with server cost ($10)

Donate via Paypal Become our Patreon

Thank you for your support!

Follow Us on Twitter!