💥
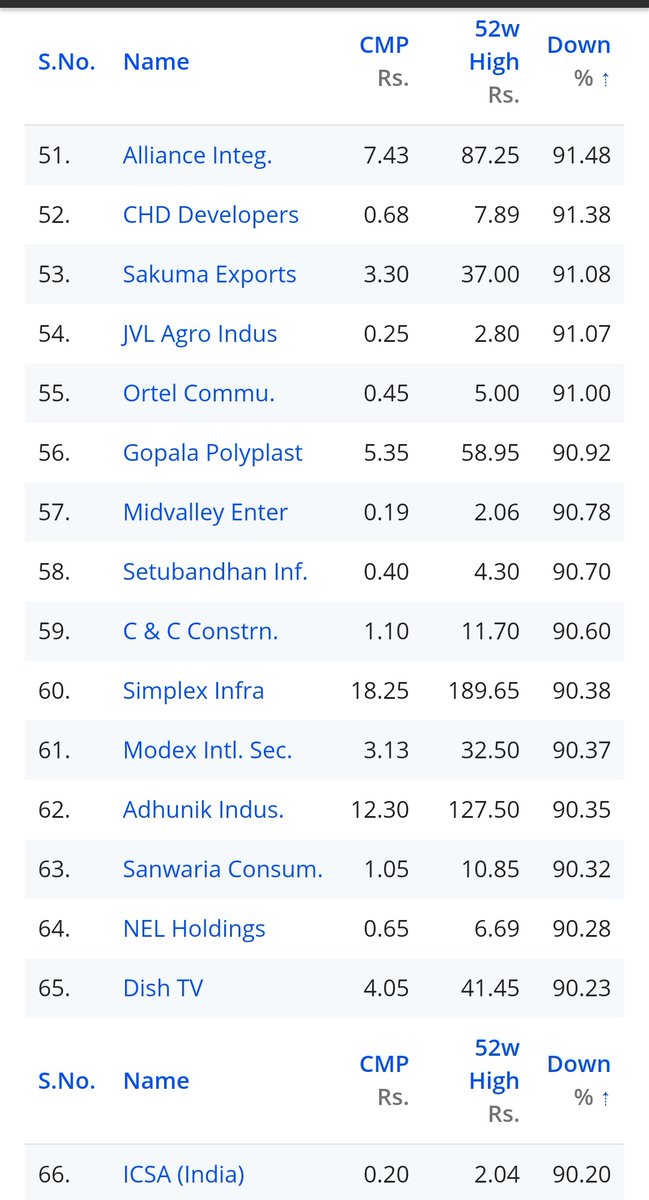
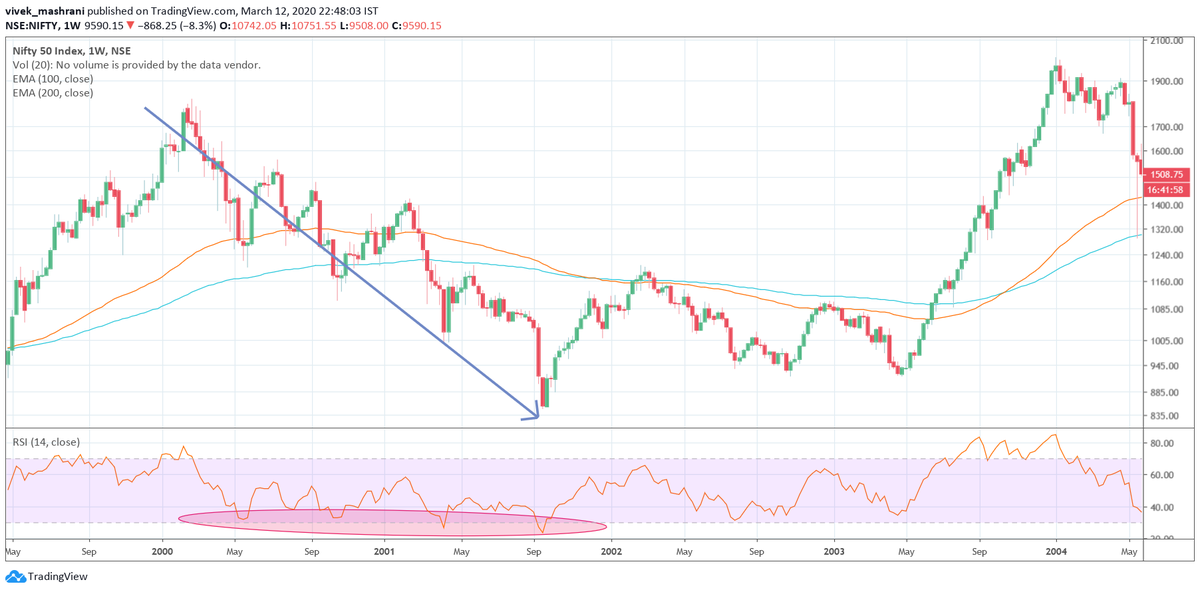
Some unbelievable memories of Market fall n rise during Covid captured in pictures..
LIFETIME LEARNINGS
Do share if you have any..
How fast times change...
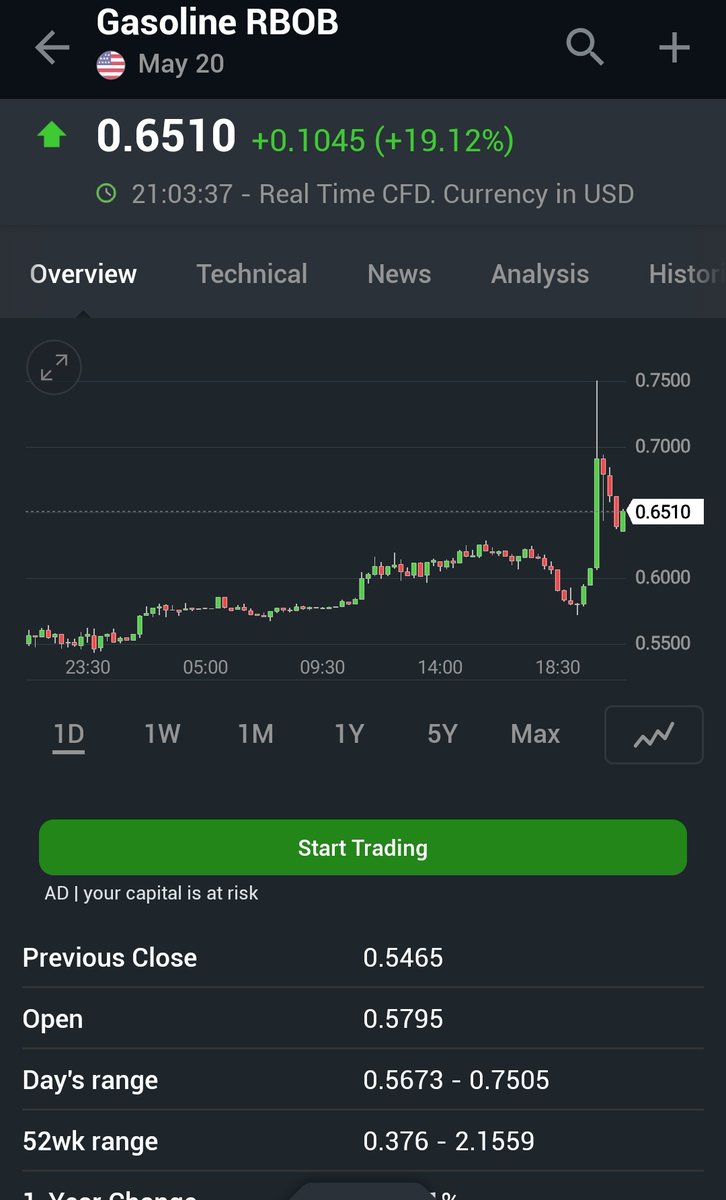
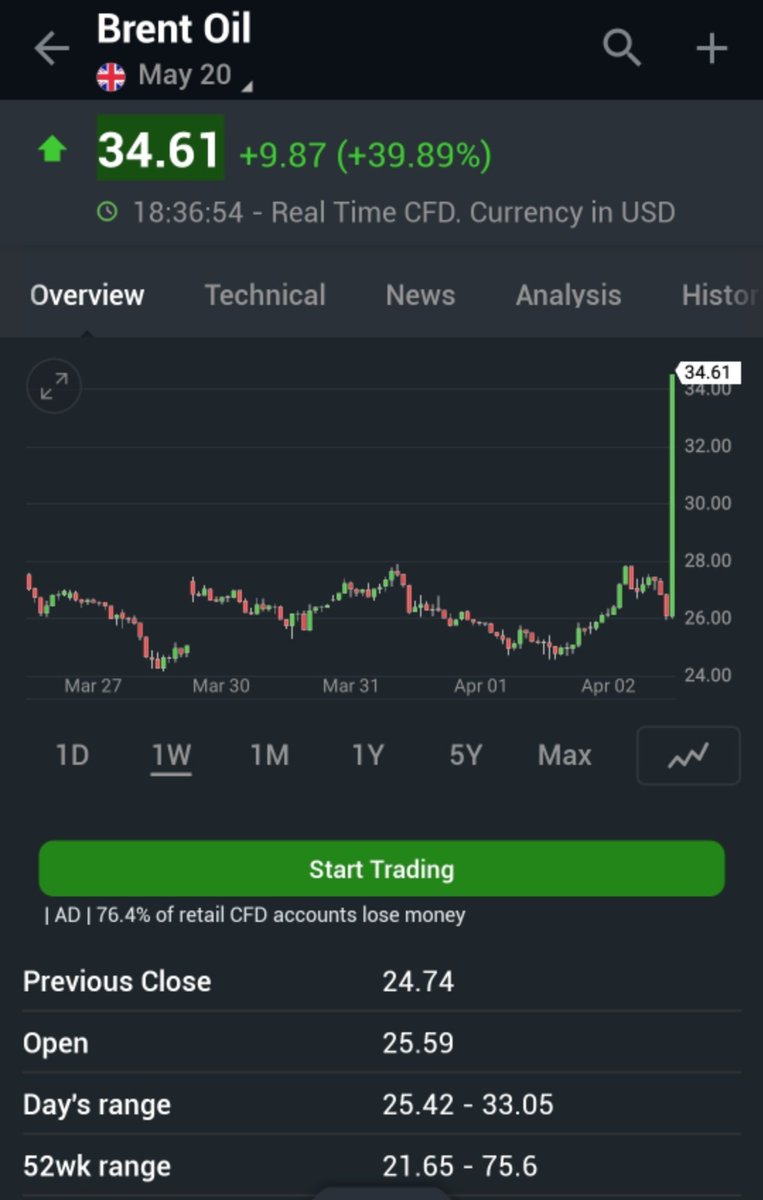
1. Brent spiked >40% in a day..
(1/n)
#investing
Some unbelievable memories of Market fall n rise during Covid captured in pictures..
LIFETIME LEARNINGS
Do share if you have any..
How fast times change...
1. Brent spiked >40% in a day..
(1/n)
#investing
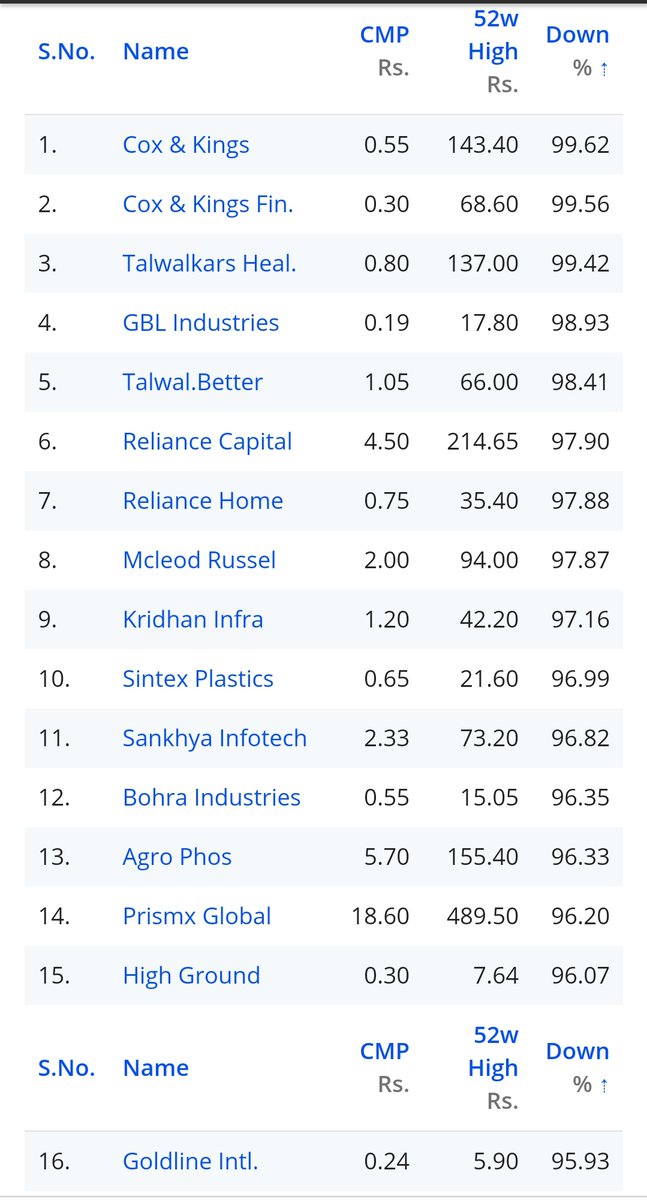
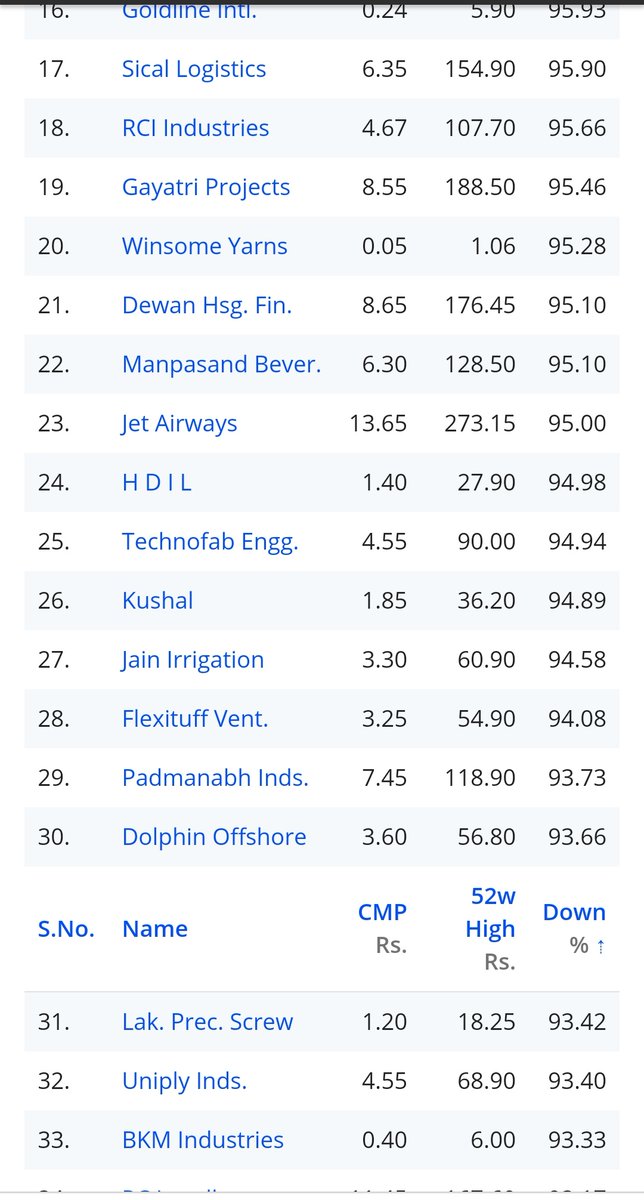
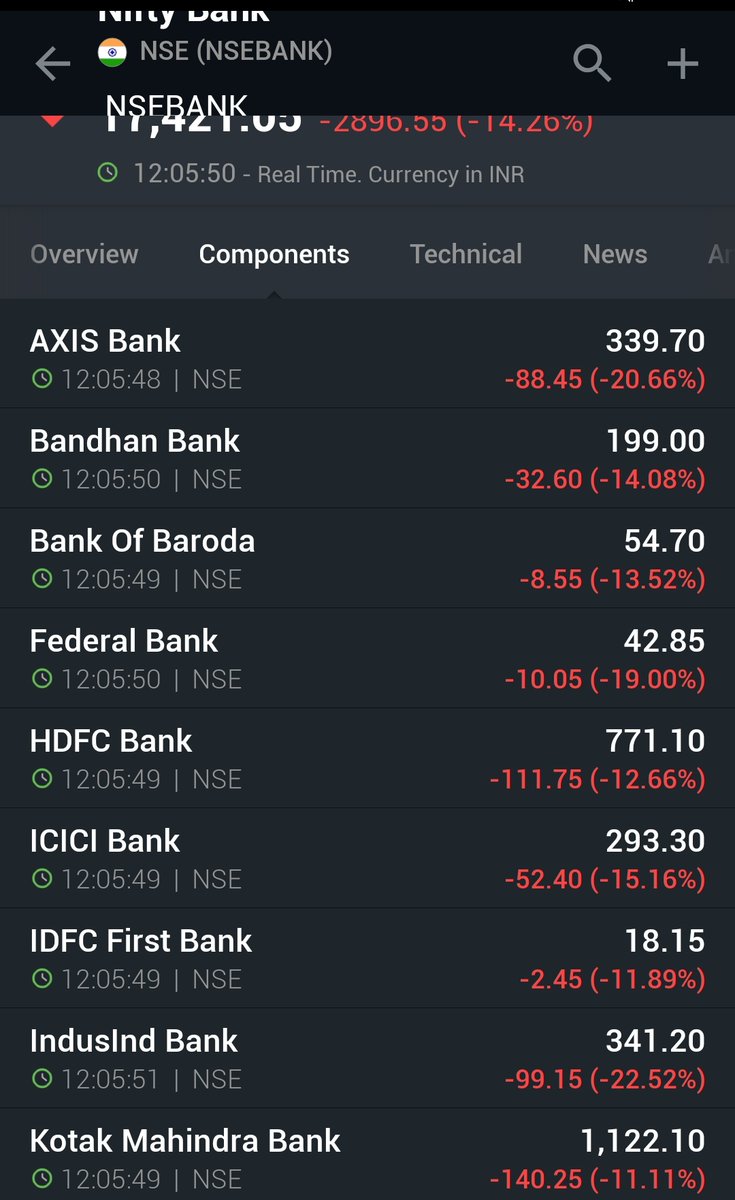
3. This was bloodbath in Indian Banking sector...
Who said value investing is easy? How many value investors could buy here
@suru27 @Longterm_wealth
(3/n)
Who said value investing is easy? How many value investors could buy here
@suru27 @Longterm_wealth
(3/n)
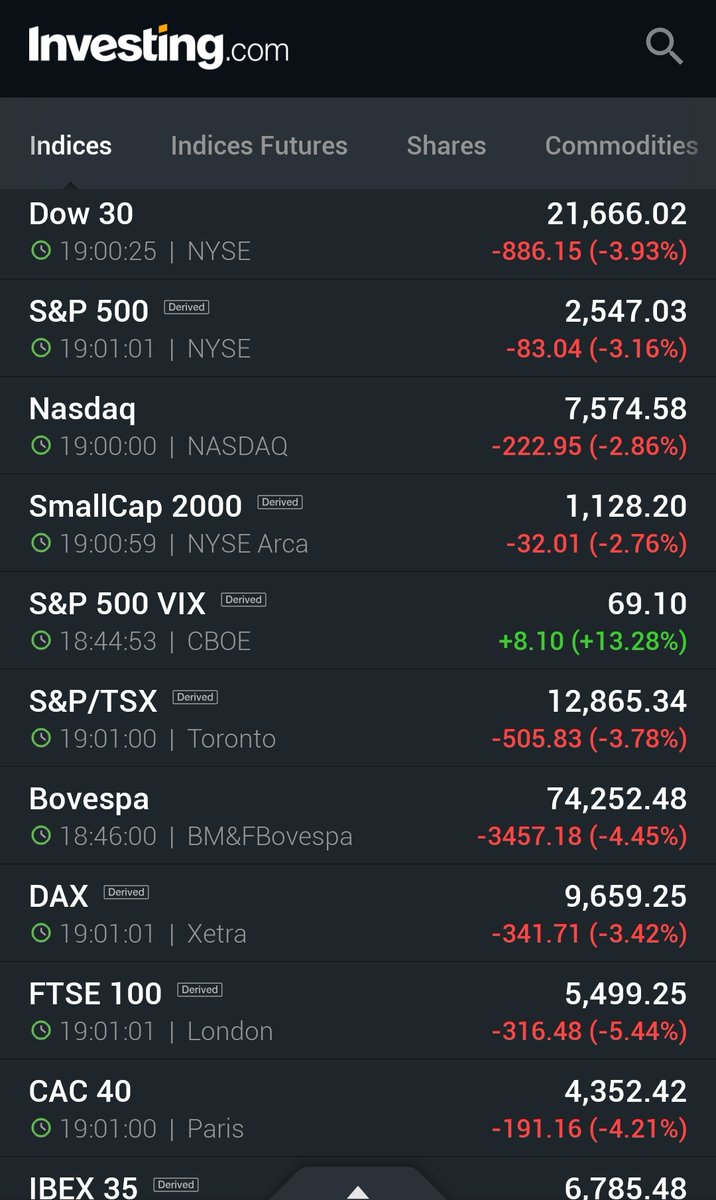
4. We all fall down...
Global markets shaken all around..
Who said global diversification reduces risk?
(4/n)
Global markets shaken all around..
Who said global diversification reduces risk?
(4/n)
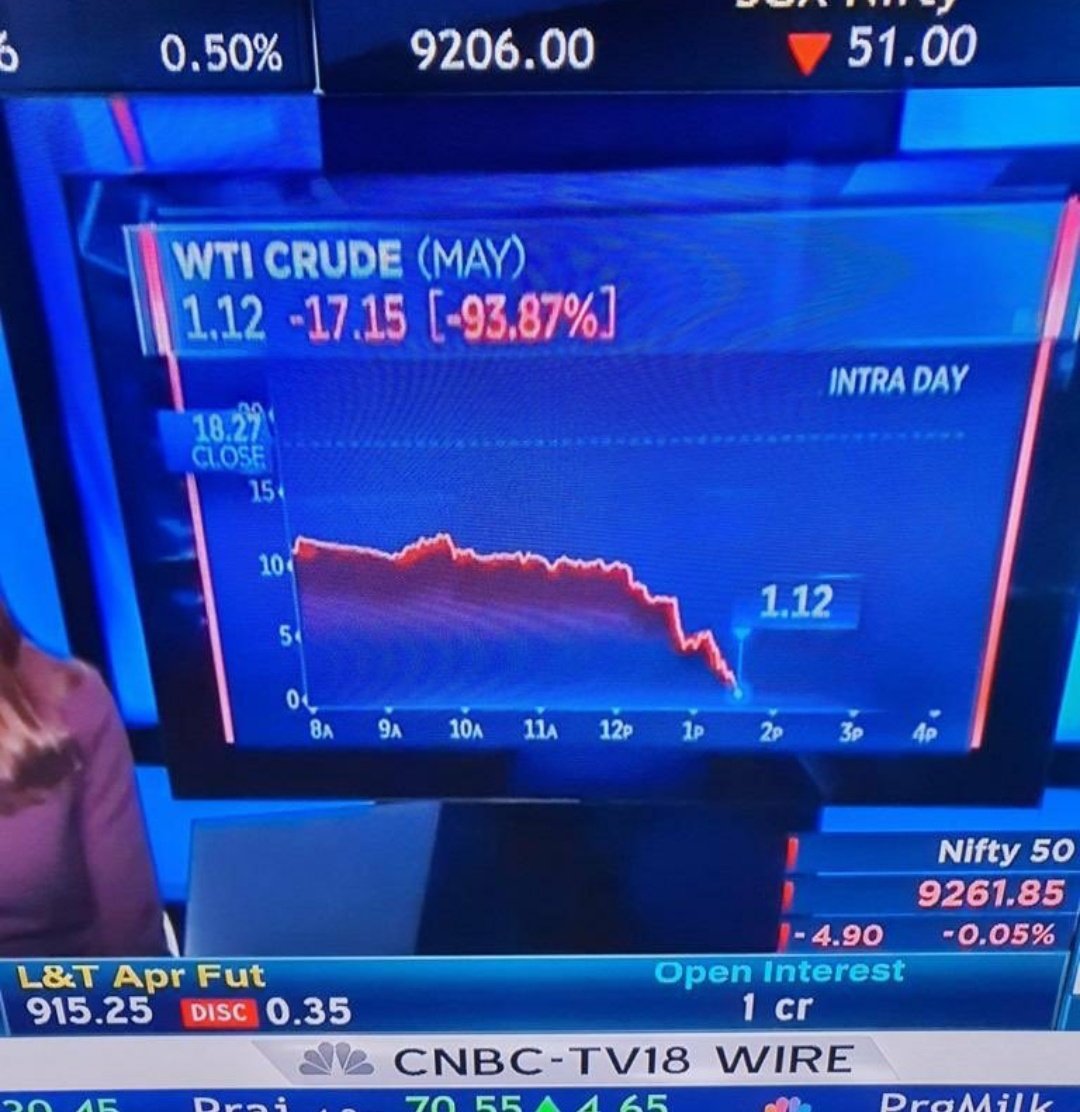
5. That GUT WRENCHING fall in crude...
Who said long-only positions are not risky?
@jitenkparmar
(5/n)
Who said long-only positions are not risky?
@jitenkparmar
(5/n)
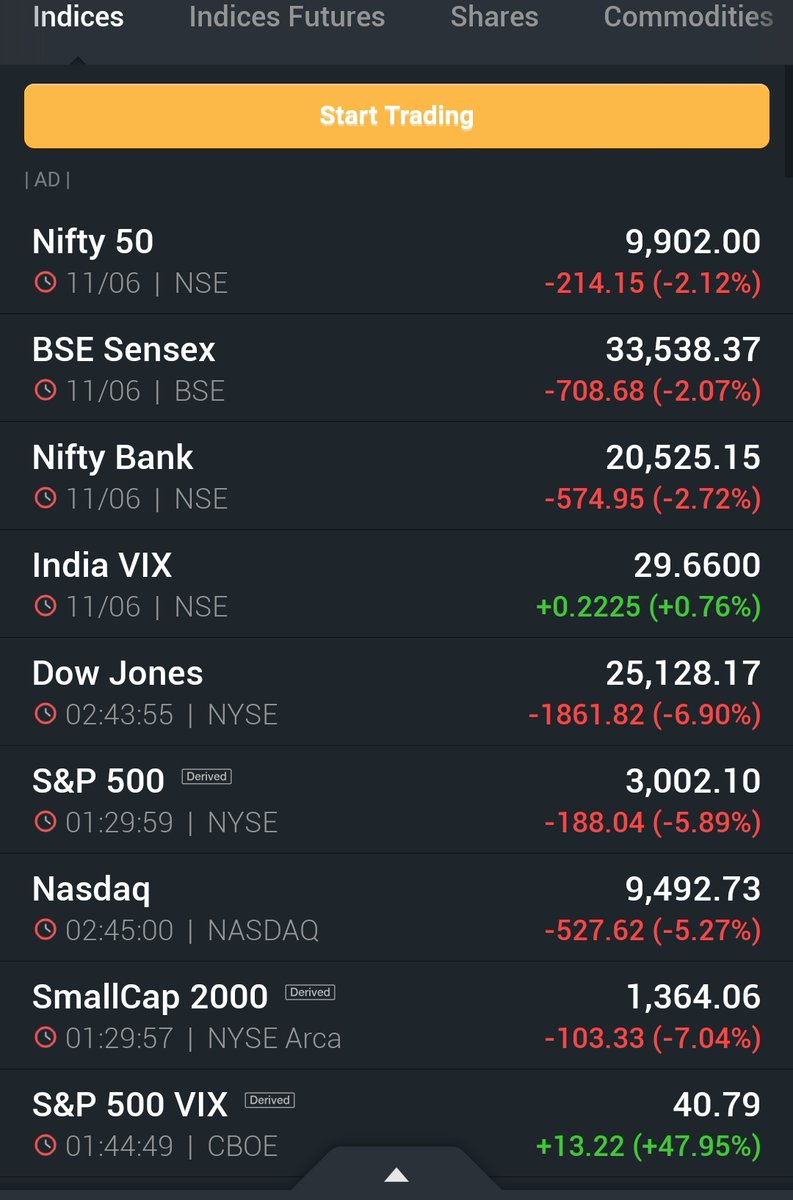
7. Deadly volatility...~48% spike in S&P 500..
Frame this and share with your kids 😀
Who said option selling is easy?
@Vishvesh03
(7/n)
Frame this and share with your kids 😀
Who said option selling is easy?
@Vishvesh03
(7/n)
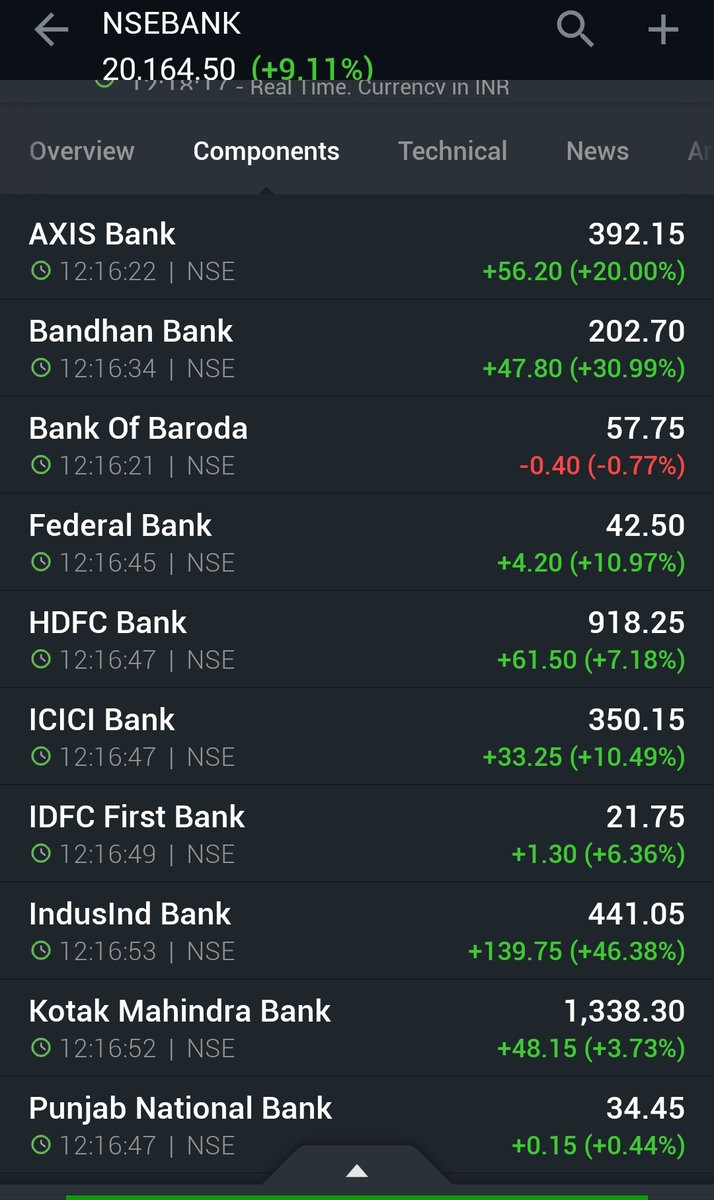
8. And this was the comeback..
Who said investing is not rewarding? 😀
@dmuthuk @Vivek_Investor
(8/n)


Who said investing is not rewarding? 😀
@dmuthuk @Vivek_Investor
(8/n)
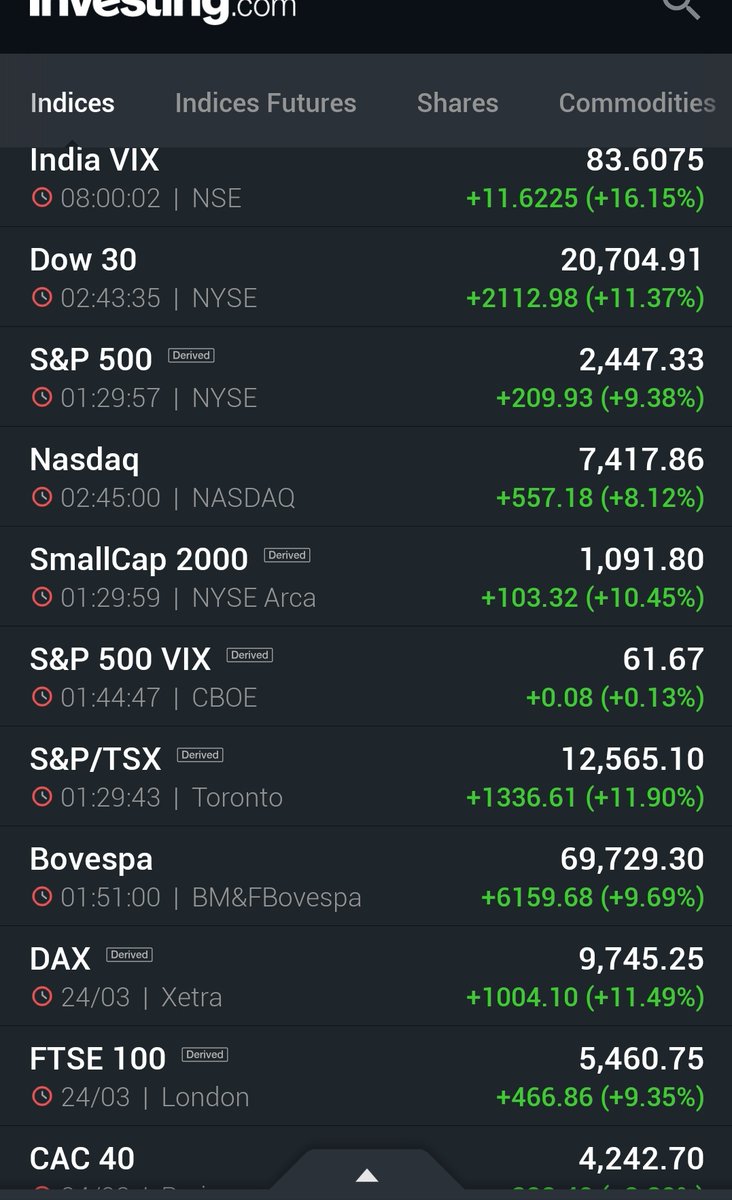
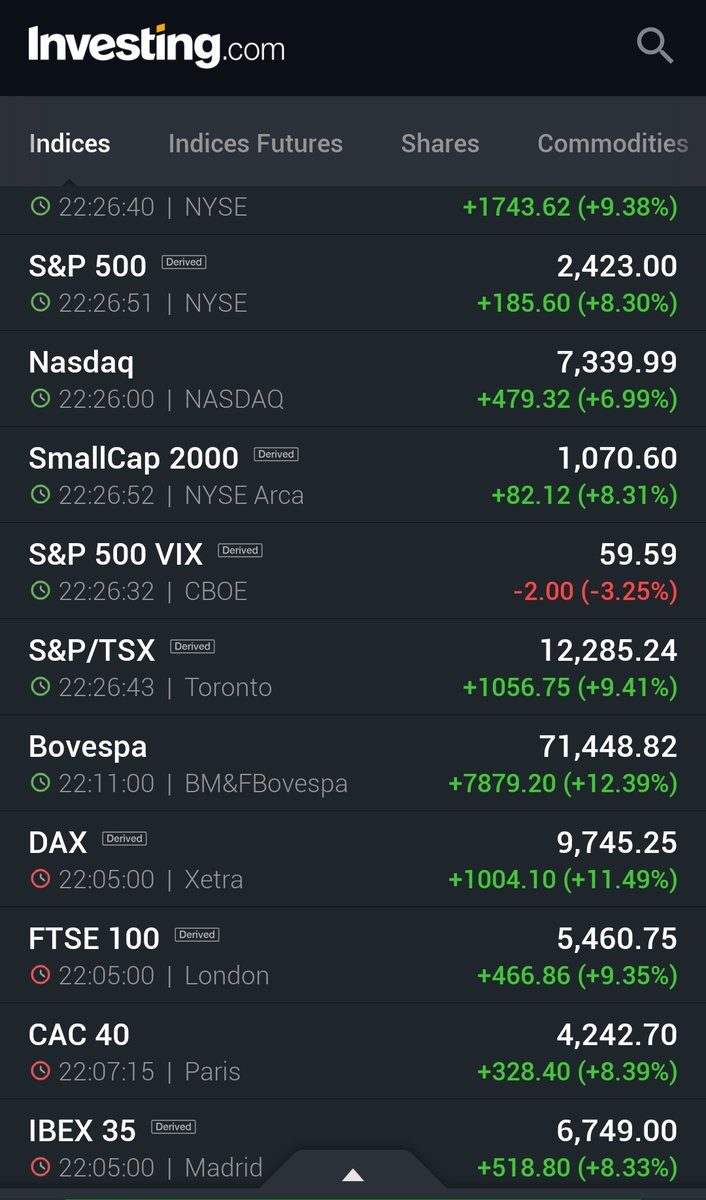
These are all memories to be cherished..lessons to be remembered..
Do share how you felt and share such interesting pictures...
To keep learning with me..
t.me/TechnoFunda_In…
Investing is simple but not easy..!!
🙏🙏
Do share how you felt and share such interesting pictures...
To keep learning with me..
t.me/TechnoFunda_In…
Investing is simple but not easy..!!
🙏🙏
• • •
Missing some Tweet in this thread? You can try to
force a refresh
