No data reported from @Folkhalsomynd today, but the situation in ICU is looking grim. @janlotvall was curious yesterday exactly how grim, so I've looked more closely.

Sweden normally has 523 ICU beds.

portal.icuregswe.org/seiva/en/rappo…
At the end of week 42, approximately 386 of those beds were available. There were 24 Covid patients.

portal.icuregswe.org/seiva/en/terti…
As of this morning, just after the end of week 45, there were 120 covid patients, an increase of nearly 100 since week 42 and a doubling since the end of October, 8 days. The previous doubling time was about 10 days.
That leaves Sweden with less than 290 available ICU beds. If Covid ICU doubling time remains at ~10 days or less, our ICU capacity will be full in less than 2 weeks.

Of course, this is Sweden as a whole, and the virus is more widespread now than it was in Spring.
No surprise therefore, that we're already seeing overall *more* pressure than in the Spring, with a greater number of patients having to be transferred because of a lack of capacity, with smaller hospitals struggling.
In Spring, we hit a peak of 558 covid patients in ICU.
Despite triaging away elderly patients, with over 80s essentially stopped being admitted from April, and few over 70, Sweden (just) exceeded it's total normal ICU capacity.

Despite this, authorities claimed health services had been protected and admissions had "plateaued"
Several observers, including myself, concluded that what had actually happened was a ceiling had been reached. Numbers in ICU weren't increasing because no more patients needed it, but because there was no more room.

On average, SIR reports a little over 10 days as the average time between admission to hospital and admission to ICU for Covid patients.

In the past 10 days, hospitalisations for Covid have increased from 474 to at least 977. More than double.

platz.se/coronavirus/#j…
This is consistent with the ICU doubling time and confirms further that we will almost certainly be at normal ICU capacity in less than 2 weeks, and exceeding the numbers of April shortly afterwards.
This is likely going to happen no matter what the effect of the recent new "recommendations". They were implemented too late to stop this, and the Uppsala experience indicates that, at best, exponential growth may have slowed, but has not stopped.
Anders Tegnell's strategy to allow the virus to spread, but slow it enough to protect health care has failed. This will be clear to see in 2-3 weeks.

/end

• • •

Missing some Tweet in this thread? You can try to force a refresh
 

Keep Current with David Steadson 🇦🇺🇸🇪🇪🇺🌍

David Steadson 🇦🇺🇸🇪🇪🇺🌍 Profile picture

Stay in touch and get notified when new unrolls are available from this author!

Read all threads

This Thread may be Removed Anytime!

PDF

Twitter may remove this content at anytime! Save it as PDF for later use!

Try unrolling a thread yourself!

how to unroll video
  1. Follow @ThreadReaderApp to mention us!

  2. From a Twitter thread mention us with a keyword "unroll"
@threadreaderapp unroll

Practice here first or read more on our help page!

More from @DavidSteadson

11 Nov
A little perspective for all the "it's just old people" brigade.

I turn 52 in exactly a month. Prior to #longcovid I was the healthiest I've been in my life, and the fittest since I was a teen - and with zero health issues.

I've just checked the Swedish data from my age group -
In Sweden, for those aged 50-59 who have tested positive for Sars-CoV-2, 1 in 40 have ended up in ICU and more than 1 in 200 have died.

This includes both men and women -
Men though, have ended up in ICU at more than double the rate of women, despite women having more +ve tests.

This means the odds of a 50-59 year old man who tests positive ending up in ICU are closer to 1 in 30 or even 1 in 20.
Read 4 tweets
10 Nov
35 New #COVID19sverige deaths reported today, taking the Folkhälsomyndigheten total to 6057. The oldest change was +3 to October 29, four separate days (Nov 1,4,6,7) had 5 new deaths reported.

A clear uptick in the cumulative deaths curve is now apparent. Image
The rolling 7 day average is rapidly increasing, and the 10-14 day lag in reporting is clear in this graph, with each line representing the averages as presented each reporting day. The most recent data is the line that ends furthest to the right. Image
Once fully updated, this data will likely show we are average well over 10 deaths per day at the moment.

The Swedish Palliative Care Registry is reporting 74 Covid deaths so far in November, an increase of 42 since Friday. Image
Read 12 tweets
10 Nov
Just been to Gävle and Skutskär with my son. Saw a long long line for covid testing in Skutskär, a few masks. No masks in Gävle apart from me. More elderly than I've seen in months. And I heard people coughing in stores for the first time in months.
Driving home it's approaching 2 o'clock so I'm wondering what the FHM stats will be. I'm discussing it with my son. My epidemiological brain, having been looking at the stats for weeks, is saying...
uggh, even with lag numbers are going to be up towards 40 new deaths, certainly more than 30. The rest of me struggles to accept this...

No, it can't be so many ... feels like just days ago it was 2 or 3, even zero, being reported.
Read 8 tweets
9 Nov
Long thread with "new" emails of a group of Swedish scientists discussing the pandemic and the Swedish response in early March.

Tom Britton comes out well as understanding itäs mroe serious than Tegnell thinks, and is trying to stay on FHMs good side and influence him.
Unfortunately, today he's made the same mistake himself, telling Aftonbladet

"A reasonable estimate is that the mortality rate is at 0.2 percent now, compared to 0.5 percent last spring"

It was 0.6 last Spring according to Folkhälsomyndigheten, in line with WHO estimates
And some studies still have it closer to 1% (and even higher!) A lot depends on age and risk factors. A good paper that summarises the data -

medrxiv.org/content/10.110…
Read 4 tweets
2 Nov
This is what Sweden needs to do, immediately

(1) Nationwide #stayathome advice for 6 weeks, with it made clear it is obligatory to follow (as it is under infectious disease law), for all but essential workers

(2) Masks indoors when you must leave home
(3) Schools for under 10 remain open, half class sizes, with half working from home, rotate weekly, masks

Immediate government support for any that need internet or computer. If necessary, employ masked tech staff with confirmed antibodies to travel to peoples homes to setup
(4) Nationwide PCR testing with local and mobile test stations. Do the whole country in a week.

(5) Immediately employ and train 1000 people to do contact tracing. This is #stayathome work
Read 6 tweets
29 Oct
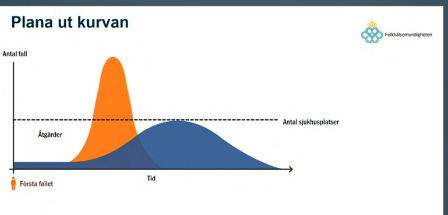
A key graph from Swedish Public Health Authorities press conference today that many may have missed the implications of. The same one was used back in March.

Remember "flatten the curve"? It's back. But there's something important to understand about this graph.
The areas in the graph (orange and blue in this case) represents the total number of people requiring hospitalization. This is a relative stable percentage of the total population, so you could draw a smaller, bigger, graph to reflect infections, with much the same shapes.
In the first instance (orange), hospitalisation needs increase rapidly, and then begins to decline. This reflects community infection spreading rapidly, and then declining.
Read 19 tweets

Did Thread Reader help you today?

Support us! We are indie developers!


This site is made by just two indie developers on a laptop doing marketing, support and development! Read more about the story.

Become a Premium Member ($3/month or $30/year) and get exclusive features!

Become Premium

Too expensive? Make a small donation by buying us coffee ($5) or help with server cost ($10)

Donate via Paypal Become our Patreon

Thank you for your support!

Follow Us on Twitter!