A little perspective for all the "it's just old people" brigade.
I turn 52 in exactly a month. Prior to #longcovid I was the healthiest I've been in my life, and the fittest since I was a teen - and with zero health issues.
I've just checked the Swedish data from my age group -
In Sweden, for those aged 50-59 who have tested positive for Sars-CoV-2, 1 in 40 have ended up in ICU and more than 1 in 200 have died.
This includes both men and women -
Men though, have ended up in ICU at more than double the rate of women, despite women having more +ve tests.
This means the odds of a 50-59 year old man who tests positive ending up in ICU are closer to 1 in 30 or even 1 in 20.
This is not the flu. This is not crossing the street. This is not riding a bicycle.
35 New #COVID19sverige deaths reported today, taking the Folkhälsomyndigheten total to 6057. The oldest change was +3 to October 29, four separate days (Nov 1,4,6,7) had 5 new deaths reported.
A clear uptick in the cumulative deaths curve is now apparent.
The rolling 7 day average is rapidly increasing, and the 10-14 day lag in reporting is clear in this graph, with each line representing the averages as presented each reporting day. The most recent data is the line that ends furthest to the right.
Once fully updated, this data will likely show we are average well over 10 deaths per day at the moment.
The Swedish Palliative Care Registry is reporting 74 Covid deaths so far in November, an increase of 42 since Friday.
Just been to Gävle and Skutskär with my son. Saw a long long line for covid testing in Skutskär, a few masks. No masks in Gävle apart from me. More elderly than I've seen in months. And I heard people coughing in stores for the first time in months.
Driving home it's approaching 2 o'clock so I'm wondering what the FHM stats will be. I'm discussing it with my son. My epidemiological brain, having been looking at the stats for weeks, is saying...
uggh, even with lag numbers are going to be up towards 40 new deaths, certainly more than 30. The rest of me struggles to accept this...
No, it can't be so many ... feels like just days ago it was 2 or 3, even zero, being reported.
No data reported from @Folkhalsomynd today, but the situation in ICU is looking grim. @janlotvall was curious yesterday exactly how grim, so I've looked more closely.
As of this morning, just after the end of week 45, there were 120 covid patients, an increase of nearly 100 since week 42 and a doubling since the end of October, 8 days. The previous doubling time was about 10 days.
(1) Nationwide #stayathome advice for 6 weeks, with it made clear it is obligatory to follow (as it is under infectious disease law), for all but essential workers
(2) Masks indoors when you must leave home
(3) Schools for under 10 remain open, half class sizes, with half working from home, rotate weekly, masks
Immediate government support for any that need internet or computer. If necessary, employ masked tech staff with confirmed antibodies to travel to peoples homes to setup
(4) Nationwide PCR testing with local and mobile test stations. Do the whole country in a week.
(5) Immediately employ and train 1000 people to do contact tracing. This is #stayathome work
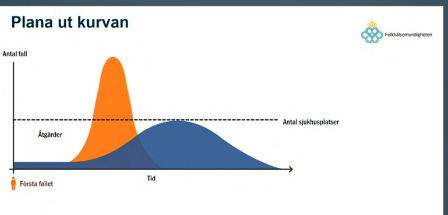
A key graph from Swedish Public Health Authorities press conference today that many may have missed the implications of. The same one was used back in March.
Remember "flatten the curve"? It's back. But there's something important to understand about this graph.
The areas in the graph (orange and blue in this case) represents the total number of people requiring hospitalization. This is a relative stable percentage of the total population, so you could draw a smaller, bigger, graph to reflect infections, with much the same shapes.
In the first instance (orange), hospitalisation needs increase rapidly, and then begins to decline. This reflects community infection spreading rapidly, and then declining.