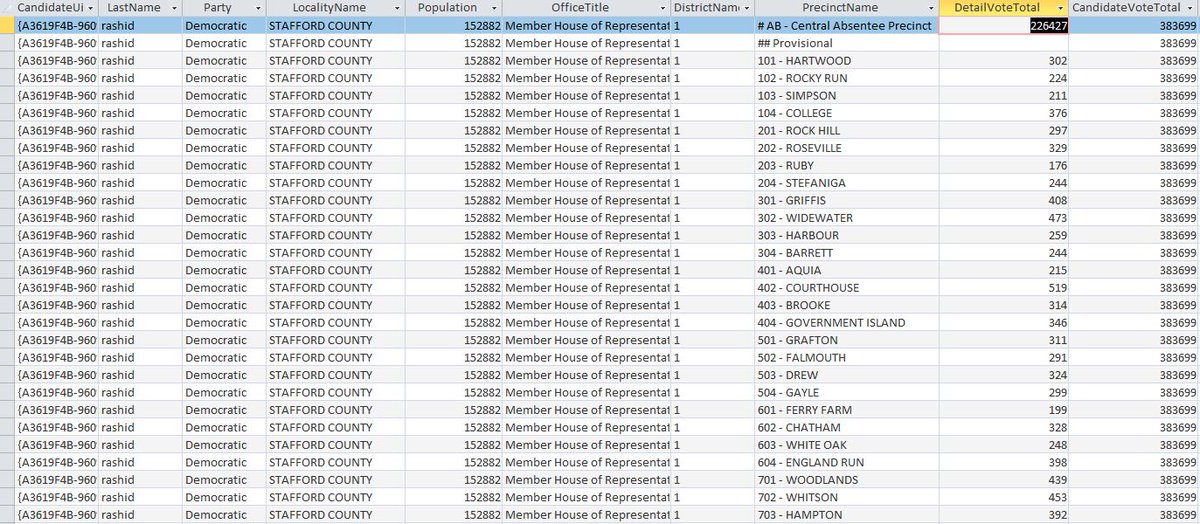
1. Change Log Update : Batch Analysis. As far as I know, there isn't a data source available of how batches of ballots voted. We see the batches in the Edison data feed, and can see their impact on the Dem / Rep %s. But that's for the President. What about down ballot? Let's see!
2. Seeing how Dem & Rep candidates performed down ballot compared to the Prez is a powerful insight that can tell us how more about what these batches contain. @va_shiva had a presentation about weighted race voting, and while I'm not familiar, the pattern I'm seeing might
3. be what his analysis showed in MI. Now these batches are in VA. I've focused on CD-1, CD-10, and CD-11. The other criteria was that the batch of votes had to be >1000 for both Biden and Trump. The big batches are more meaningful in terms of trends.
4. The analysis was to determine the difference between the Prez and House Rep candidate for both parties in the batch. Then calculate the percentage of that difference, and see how Biden performed vs Trump. There is a glaring symmetry in performance for these batches of ballots:
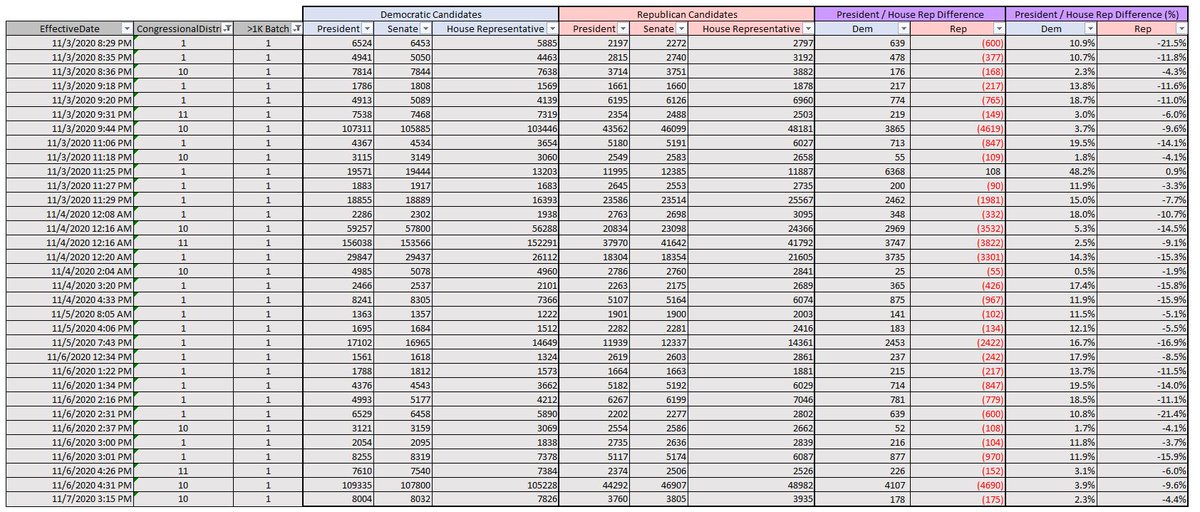
5. Each row is a separate batch. What about these districts would cause this pattern? Voters? Maybe the counting machines were configured differently from other districts? I don't see any other explanation. Ballots for Trump showing up in Biden's column looks like the answer.
6. Improper vote counting would explain the Biden only votes we've been wondering about. Vote for Prez but not down ballot. For each Trump vote given to Biden, there would theoretically be a Biden only ballot that existed to create the vote. Not according to these batches because
7. The ballot was a trump vote that got switched. There's thousands of votes in these batches with appear to just be moved over to Biden. I wanted to believe otherwise, but at this point, I need proof that the machines were working properly to believe.
8. As for the other districts, here's the pattern in Districts 6 and 8. Same shifting as we see in District 1, 10, and 11. Again, note the symmetry in the shifting in the number of votes (not %). Wonder what an audit or manual check would reveal.
9. If anyone wants to dig further, I'm open to suggestions, but this is compelling that something systematic was occurring to skew these numbers in this manner. I'm open to other ways of analyzing this data, but it appears to align with @va_shiva presentation.

• • •

Missing some Tweet in this thread? You can try to force a refresh
 

Keep Current with FishingInfo

FishingInfo Profile picture

Stay in touch and get notified when new unrolls are available from this author!

Read all threads

This Thread may be Removed Anytime!

PDF

Twitter may remove this content at anytime! Save it as PDF for later use!

Try unrolling a thread yourself!

how to unroll video
  1. Follow @ThreadReaderApp to mention us!

  2. From a Twitter thread mention us with a keyword "unroll"
@threadreaderapp unroll

Practice here first or read more on our help page!

More from @FishingForInfo

14 Nov
Limitations of High-level Analyses : After the Dr Shiva presentation, there has been a lot of effort dedicated to to understanding the pattern he showed in his graph. Many tweets speculating about the reason such a pattern might be true / reasonable.
2. Some have compared the graphs across elections (2016 and 2020) to understand how the trends compare and what the differences may mean in terms of the voters. While these analyses are interesting from an academic perspective, we should ask what is actually being compared?
3. Let's take a step back from voting results analyses, and consider what these results are and what they represent. Using a random county as an example, an analysis of this county's precincts will show us the outlines / broad pattern of the votes tabulated for the county.
Read 21 tweets
13 Nov
Deep Dive Explanation of Approach / Analysis : I want to provide the context of the work I am doing, and the reasoning behind it. I started this with a question : Why did R's do so well down ballot, and not at the top? In order to answer this question, I needed a suitable dataset
2. The ideal dataset would allow us to see, for each batch of ballots, the landscape of the votes (e.g. which candidates received the votes, and by what proportions). And not just any batch would suffice to perform this analysis.
3. Batches of ballots needed to be large (e.g. many ballots), and must include votes for Prez, Senate, and House Rep for both Dems and Reps (3 races x 2 parties). The batch is a self contained example of voting behavior, that would be random within a district.
Read 17 tweets
11 Nov
1. Change Log Update : I've spent some time going through the data to get a better understanding of the relationships between the rows, and how to identify batches of votes that were loaded into the system. I focused on the largest batches in CD-1, CD-10, and CD-11.
2. I was particularly focused on batches that had both Dem and Rep candidates for Prez, Senate, and House. The purpose was to compare the votes across the ballots. Expecting to see Prez with the largest numbers, and the Senate / House being lower numbers.
3. Well, this is true for the Dem candidates, but not for Rep candidates. I haven't manually checked all the batches, but this tends to hold true for smaller batches (less than 50K). Here is an example of what I mean for this unusual trend in the votes of these batches.
Read 14 tweets
10 Nov
Found another file on VA website. This one is a "Change Control" log for votes in the system. I've only begun to explore this, but there's some interesting activity for VA-7 for Spanberger. On Oct 30th, a preload change was initiated that would expire at 11/4 @ 4:13AM
At 4:13AM, 66,498 votes are assigned to her with an expiration of 11/5 @ 11:26 AM. When this comes around, the total is adjusted to 63,687. Reason given is "Tabulation Error in Precinct". The last change has no expiration date. These changes affected Chesterfield County.
This lines up with the raw vote total for Spanberger in Chesterfield County. There's also a change records to assign Rashid (VA-1) in Stafford county. See both pics attached :
Read 8 tweets
9 Nov
@WontMarch4Soros @bedivere_knight @ColdPotatoSpud After thinking about the data / analyses I've been doing on the raw data vs website and other reports, I believe I have an explanation for why Rashid has so many more votes than Wittman. This will be a long explanation :
1. This explanation may bounce around a bit, but touches on different aspects of the pics I've posted across different threads. Ask questions if things don't seem to follow, since they are related.
If we think about how elections work, different precincts will have diff ballots
2. The ballots are different because downstream the (house reps) are different in the various districts. There are only two races that will be on every ballot across every district precinct. Senate and President. This is important.
Read 24 tweets
9 Nov
@ColdPotatoSpud @bedivere_knight @Peoples_Pundit 4) The other odd thing in the turnout file is that Stafford County has a huge amount of absentee ballots that were cast "In Person", which you don't see in many of the other counties. Here's the details :
@ColdPotatoSpud @bedivere_knight @Peoples_Pundit The absentee ballots reported in the turnout file is bizzare (high), but is nothing close to what the raw data say are the absentee ballots associated with Rashid in Stafford County. See the details :
@ColdPotatoSpud @bedivere_knight @Peoples_Pundit Those pics show a large number of votes associated with Rashid in the raw data, but in the turnout file, there is a much smaller number of ballots. Since each vote for Rashid must equal 1 ballot. So we should see a minimum of 200K ballots in the Turnout file, but again it doesn't
Read 4 tweets

Did Thread Reader help you today?

Support us! We are indie developers!


This site is made by just two indie developers on a laptop doing marketing, support and development! Read more about the story.

Become a Premium Member ($3/month or $30/year) and get exclusive features!

Become Premium

Too expensive? Make a small donation by buying us coffee ($5) or help with server cost ($10)

Donate via Paypal Become our Patreon

Thank you for your support!

Follow Us on Twitter!