Deep Dive Explanation of Approach / Analysis : I want to provide the context of the work I am doing, and the reasoning behind it. I started this with a question : Why did R's do so well down ballot, and not at the top? In order to answer this question, I needed a suitable dataset
2. The ideal dataset would allow us to see, for each batch of ballots, the landscape of the votes (e.g. which candidates received the votes, and by what proportions). And not just any batch would suffice to perform this analysis.
3. Batches of ballots needed to be large (e.g. many ballots), and must include votes for Prez, Senate, and House Rep for both Dems and Reps (3 races x 2 parties). The batch is a self contained example of voting behavior, that would be random within a district.
4. By having all these attributes, we would have clean examples to understand how that batch of the electorate cast their votes. This would give us a glimpse of the overall picture for the rest of the batches in that district. Now, what is the purpose of this analysis?
5. This analysis will reveal how ballots were cast. The data is after the tabulation process has been run, and the votes determined for the candidates in the race. The tabulation machines are an automated process that should produce consistent results (calculate the same way).
6. When you have the same automated process deployed in multiple locations, it is important to compare the trends and patters across these locations in order to identify anomalies and issues. This is a necessary validation and QC step to be confident all processes operate thesame
7. Differences in the patterns across these processes indicate not all the processes are operating the same way. My analyses are to show the patterns across the districts and see how patterns variety. Think of it as a process audit, not a ballot audit.
8. Processes can be manipulated, and when that occurs this type of analysis leads us to the affected process(es). Let's look at a comparison between VA-1 vote patterns and VA-2 vote patters from the batches that meet the criteria specified earlier. To help, here is a district map
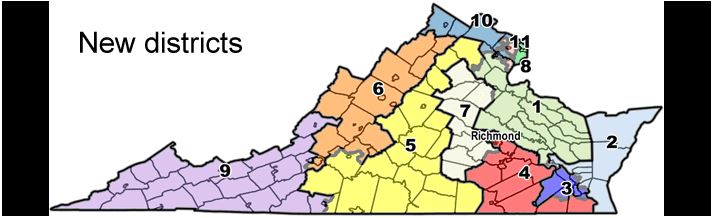
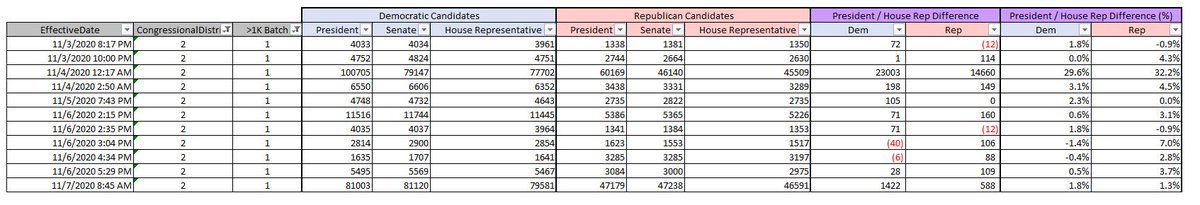
9. From the map, VA-1 and VA-2 neighbor each other. So let's see how voting patterns are different across these two districts. Here are their voting behaviors in the batches. VA-1 show's that votes are consistently going one way (to Dems). Why?
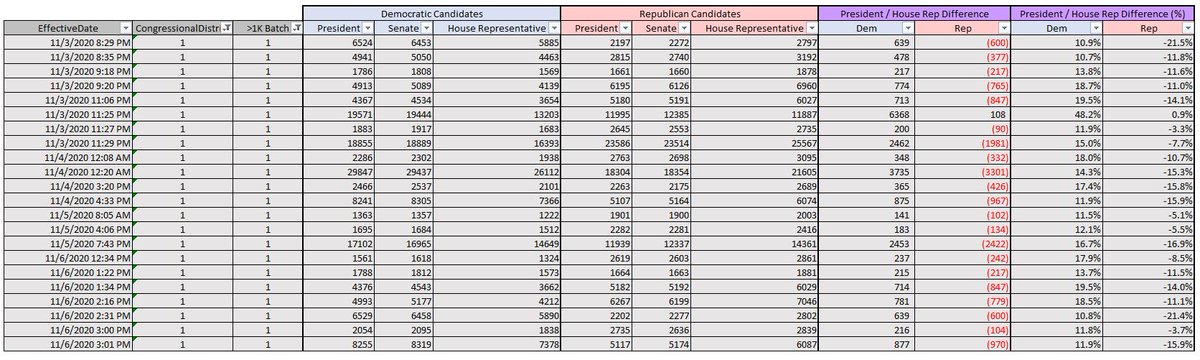
10. Is it possible that split ticket voters only exist in the Republican party? I don't believe so. The symmetry of these differences between Dem and Rep is startling. How is it that batch after batch in VA-1, there is the same proportion of R votes going to Dem candidates?
11. This would require these batches of random ballots to be perfect mixes each and every time. That is not naturally possible. It is only possible when viewed as the result of a manipulated process. It's something I am familiar w/ from working in corporate fraud investigations.
12. We don't see this patter in VA-2. Why? Because the process hasn't been manipulated. We see some differences, but there isn't the same consistent patter in batch after batch after batch. This is natural result. So what does this mean? How could this have happened?
13. Two possibilities for why the process is different in VA-1. First, the machine is configured differently than VA-2. This means the machine is doing as it was instructed, and improperly counting R votes as D votes. Second, when results are sent they are altered in between.
14. I believe it is more likely that the machines are configured incorrectly, and therefore generating incorrect totals, which are then sent to central office. Either way, a manual recount will confirm the issue. More importantly, this analysis could be done for every state.
15. This would be far more efficient that a full manual recount. It should be a test to see if a manual recount is necessary. The districts with these patterns should be manually recounted, and a team should investigate the configuration of the machines.
15. On the politics of this issue : people are stressing "voter fraud" in the election. While undoubtedly some did occur, like with most elections. Ultimately, it is a distraction from the core issue. This is election interference on a scale I couldnt imagine prior tothe analysis
16. I have collected the same files for 2016 and 2012 in order to perform the same analysis. As a US citizen, I must know if this has occurred before. I'll be dedicating all of my time next week to answering this question. I welcome anyone who has time and talent to assist.

• • •

Missing some Tweet in this thread? You can try to force a refresh
 

Keep Current with FishingInfo

FishingInfo Profile picture

Stay in touch and get notified when new unrolls are available from this author!

Read all threads

This Thread may be Removed Anytime!

PDF

Twitter may remove this content at anytime! Save it as PDF for later use!

Try unrolling a thread yourself!

how to unroll video
  1. Follow @ThreadReaderApp to mention us!

  2. From a Twitter thread mention us with a keyword "unroll"
@threadreaderapp unroll

Practice here first or read more on our help page!

More from @FishingForInfo

14 Nov
Limitations of High-Level Analyses Part 2 : Some out there are taking Dr Shiva's analysis and replicating it for Democratic votes to compare and see if the pattern is different. From a couple I've seen, there is a similar downward linear pattern that's less steep.
2. This has led some to conclude that this is in fact a natural pattern that has naturally occurred as the result of the local the electorate, and therefore, there's nothing untoward about the pattern. If it's happening for both Ds and Rs, it can't be a problem. Right? No!
3. When you see the same downward linear slope, it doesn't mean the local electorate is uniquely voting in those areas. It means that manipulation is occurring on both sides. The different in the steepness of the pattern allows to understand the severity of the manipulation.
Read 12 tweets
14 Nov
Limitations of High-level Analyses : After the Dr Shiva presentation, there has been a lot of effort dedicated to to understanding the pattern he showed in his graph. Many tweets speculating about the reason such a pattern might be true / reasonable.
2. Some have compared the graphs across elections (2016 and 2020) to understand how the trends compare and what the differences may mean in terms of the voters. While these analyses are interesting from an academic perspective, we should ask what is actually being compared?
3. Let's take a step back from voting results analyses, and consider what these results are and what they represent. Using a random county as an example, an analysis of this county's precincts will show us the outlines / broad pattern of the votes tabulated for the county.
Read 21 tweets
12 Nov
1. Change Log Update : Batch Analysis. As far as I know, there isn't a data source available of how batches of ballots voted. We see the batches in the Edison data feed, and can see their impact on the Dem / Rep %s. But that's for the President. What about down ballot? Let's see!
2. Seeing how Dem & Rep candidates performed down ballot compared to the Prez is a powerful insight that can tell us how more about what these batches contain. @va_shiva had a presentation about weighted race voting, and while I'm not familiar, the pattern I'm seeing might
3. be what his analysis showed in MI. Now these batches are in VA. I've focused on CD-1, CD-10, and CD-11. The other criteria was that the batch of votes had to be >1000 for both Biden and Trump. The big batches are more meaningful in terms of trends.
Read 10 tweets
11 Nov
1. Change Log Update : I've spent some time going through the data to get a better understanding of the relationships between the rows, and how to identify batches of votes that were loaded into the system. I focused on the largest batches in CD-1, CD-10, and CD-11.
2. I was particularly focused on batches that had both Dem and Rep candidates for Prez, Senate, and House. The purpose was to compare the votes across the ballots. Expecting to see Prez with the largest numbers, and the Senate / House being lower numbers.
3. Well, this is true for the Dem candidates, but not for Rep candidates. I haven't manually checked all the batches, but this tends to hold true for smaller batches (less than 50K). Here is an example of what I mean for this unusual trend in the votes of these batches.
Read 14 tweets
10 Nov
Found another file on VA website. This one is a "Change Control" log for votes in the system. I've only begun to explore this, but there's some interesting activity for VA-7 for Spanberger. On Oct 30th, a preload change was initiated that would expire at 11/4 @ 4:13AM
At 4:13AM, 66,498 votes are assigned to her with an expiration of 11/5 @ 11:26 AM. When this comes around, the total is adjusted to 63,687. Reason given is "Tabulation Error in Precinct". The last change has no expiration date. These changes affected Chesterfield County.
This lines up with the raw vote total for Spanberger in Chesterfield County. There's also a change records to assign Rashid (VA-1) in Stafford county. See both pics attached :
Read 8 tweets
9 Nov
@WontMarch4Soros @bedivere_knight @ColdPotatoSpud After thinking about the data / analyses I've been doing on the raw data vs website and other reports, I believe I have an explanation for why Rashid has so many more votes than Wittman. This will be a long explanation :
1. This explanation may bounce around a bit, but touches on different aspects of the pics I've posted across different threads. Ask questions if things don't seem to follow, since they are related.
If we think about how elections work, different precincts will have diff ballots
2. The ballots are different because downstream the (house reps) are different in the various districts. There are only two races that will be on every ballot across every district precinct. Senate and President. This is important.
Read 24 tweets

Did Thread Reader help you today?

Support us! We are indie developers!


This site is made by just two indie developers on a laptop doing marketing, support and development! Read more about the story.

Become a Premium Member ($3/month or $30/year) and get exclusive features!

Become Premium

Too expensive? Make a small donation by buying us coffee ($5) or help with server cost ($10)

Donate via Paypal Become our Patreon

Thank you for your support!

Follow Us on Twitter!