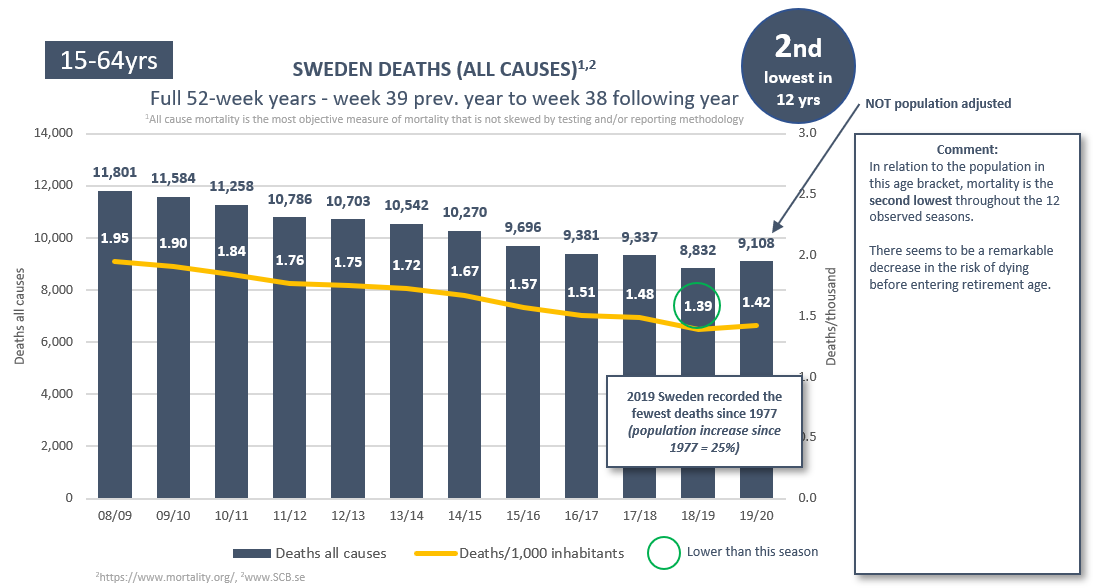
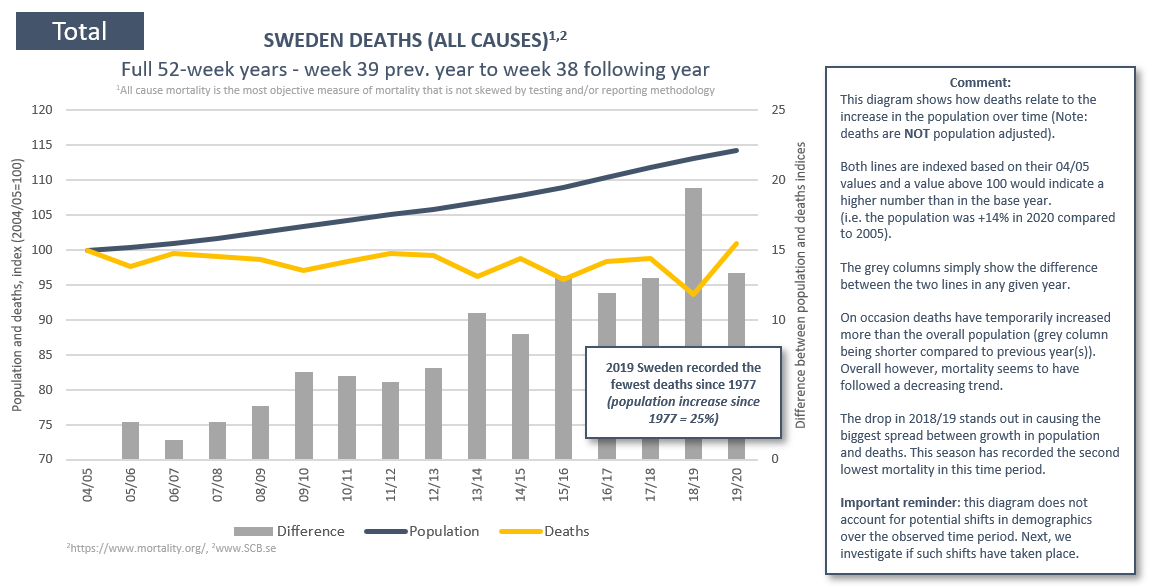
1/21 Sweden. This respiratory illness season's age adjusted all-cause mortality was significantly lower than both 2016/17 and 2017/18. Will our myopic focus on one cause of death optimize public health outcomes? Why isn’t all-cause mortality the metric we strive to minimize? 

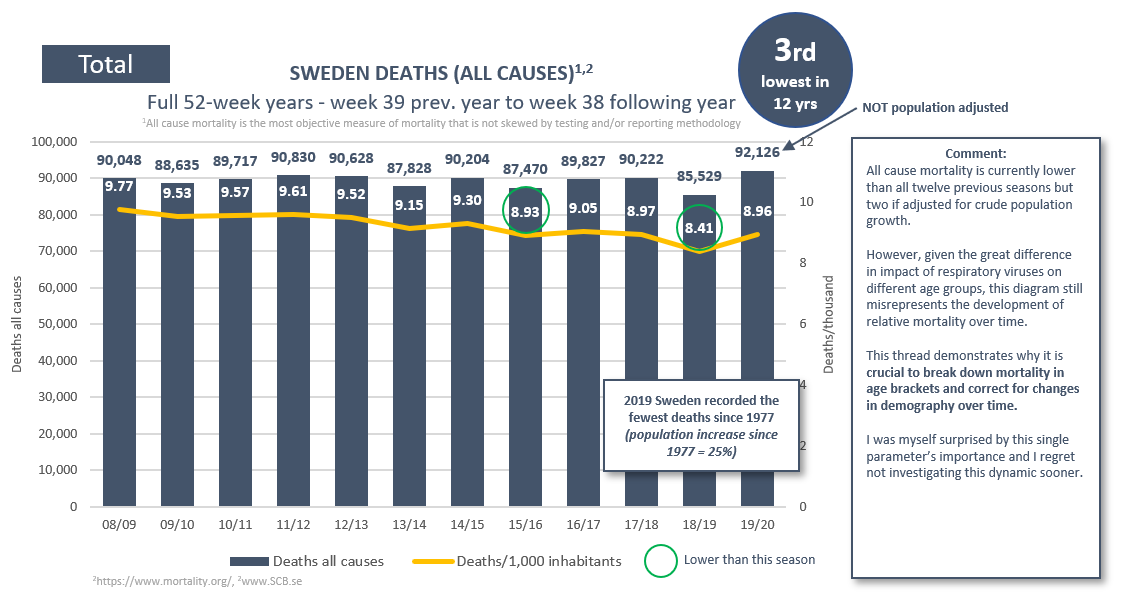
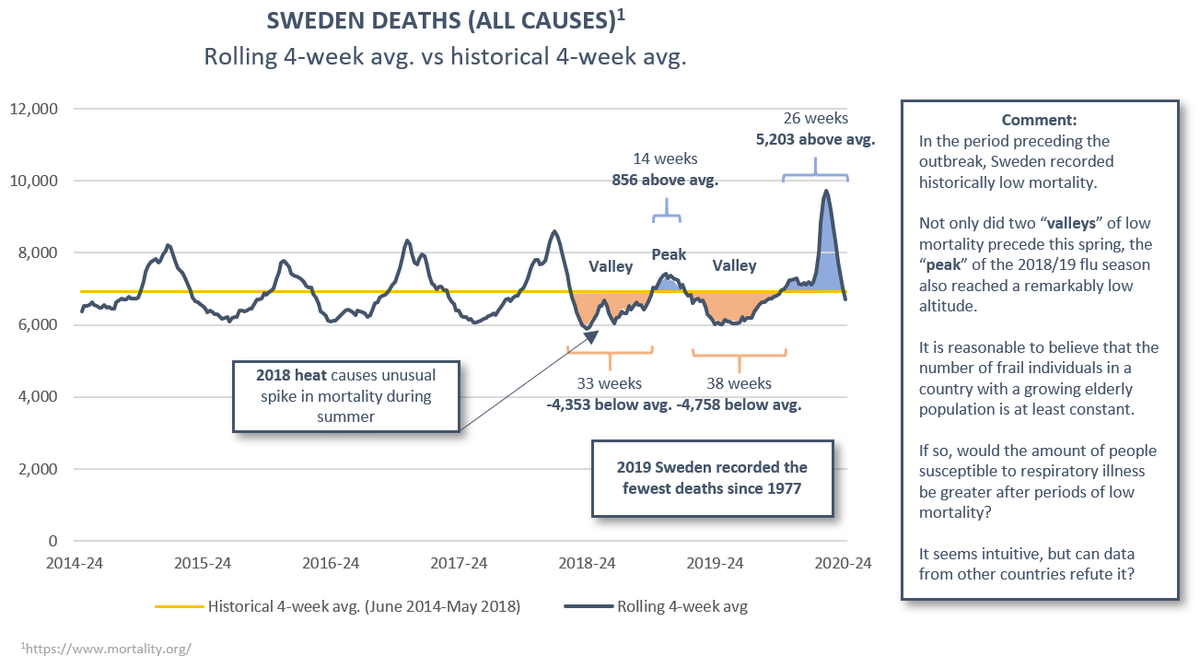
2/21 Crude pop. adj. deaths this season never caught up with 2016/17 levels. It did so only briefly compared to 2017/18 (week 21) but returned to a deficiency by week 36. By week 41 cumulative deaths 2019/20 were approximately 500 and 1,500 below the previous seasons.


3/21 Please note that I’ve only corrected for the crude population growth of 3.8% 2016-2020. I made no adjustment for the more rapid growth in the elderly population, and yet mortality came out lower this season (despite simultaneous prevalence of both flu and Covid19).
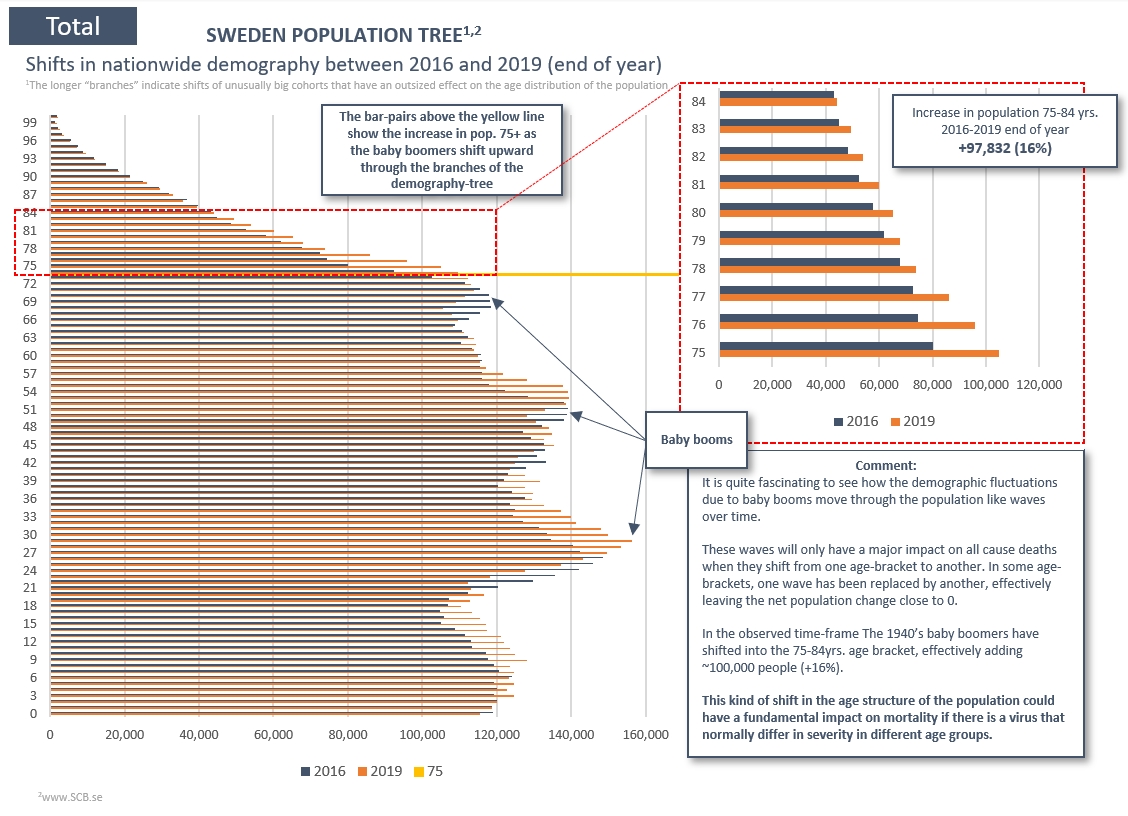
4/21 Seeing as some age-groups are at much higher risk for severe respiratory illness, we can make more accurate if analyzing more tightly defined age-brackets. Please see the thread below for an introduction to the importance of demographical change.
https://twitter.com/EffectsFacts/status/1314263092675706881?s=20
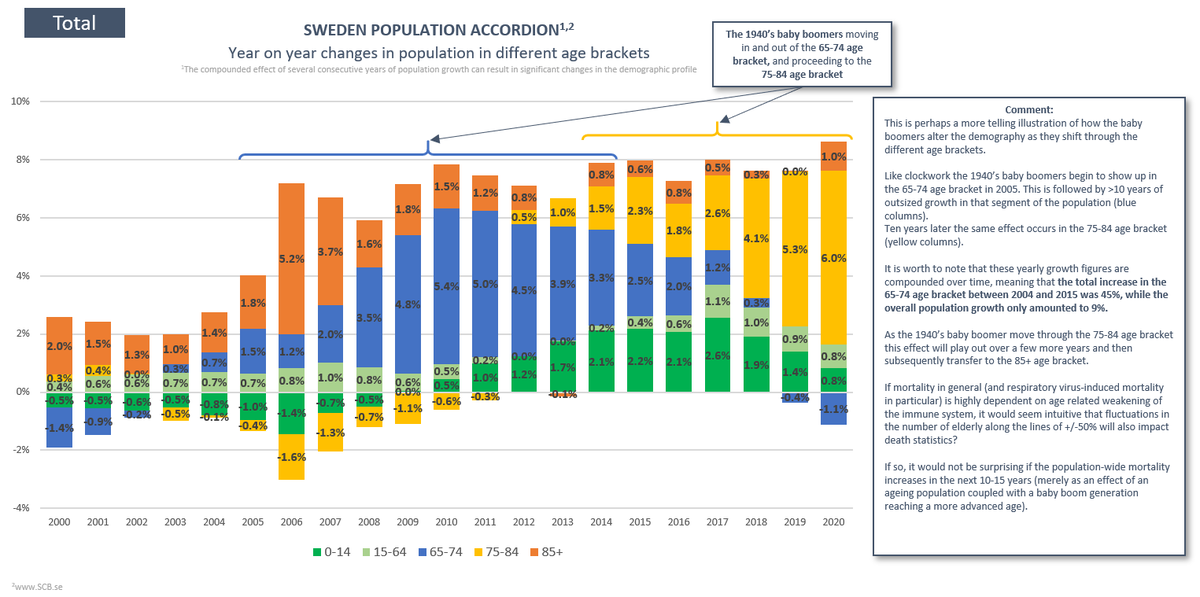
5/21 This table shows the changes in population that underpin all the subsequent tables and diagrams. Notably, 70-74 and 75-79 have increased by 26% and 24%, respectively. 80-84 and 90+ have increased by 8% and 6% while 85-89 has been largely unchanged.

6/21 Simply put: the demography more susceptible to respiratory illness (70+) increased by 17%, while the low-risk proportion of the population (69 and below) only grew by 4% over between 2015-2020.

7/21 This summarizes the whole Eurostat dataset in one color coded table (green is good, red is bad). It shows that this season has been among the least deadly in the past ten years for 15 out of 19 age groups, and much less deadly compared to what we saw in 2016/17 and 2017/18.

8/21 It turns out 14 age brackets recorded lower mortality than in 2016/17, and only five age brackets showed excess. Out of these five, only two were age groups that show some impact from Covid19. In these two, the difference was 1% and 2%, respectively.
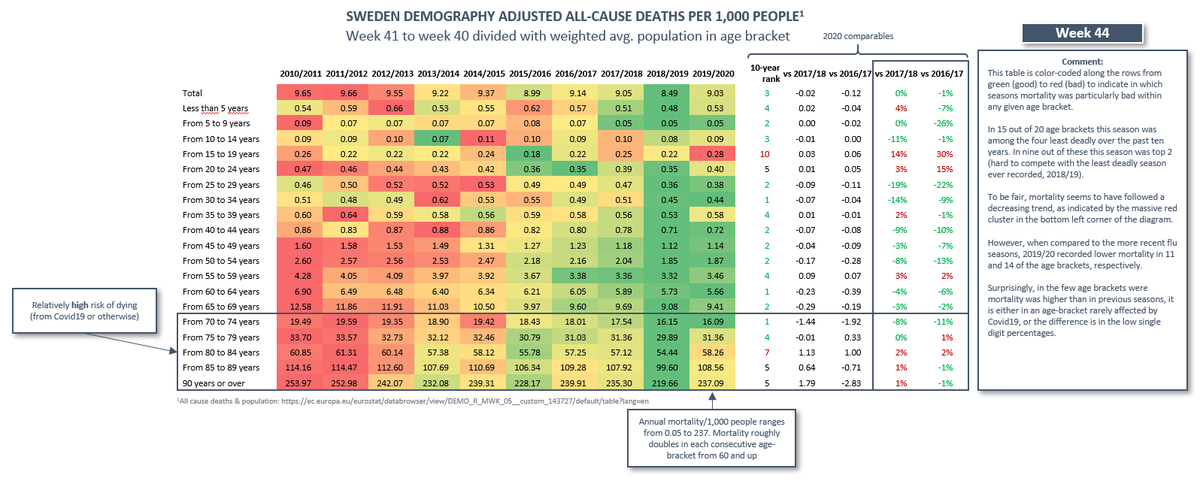
9/21 Coincidentally, two of the age groups with outsized mortality 2019/20 was the high schoolers and university students (15-24), the only age group to have had in-person teaching suspended. Fortunately, it doesn’t seem to be a direct LD effect as the excess occurred in week 2.

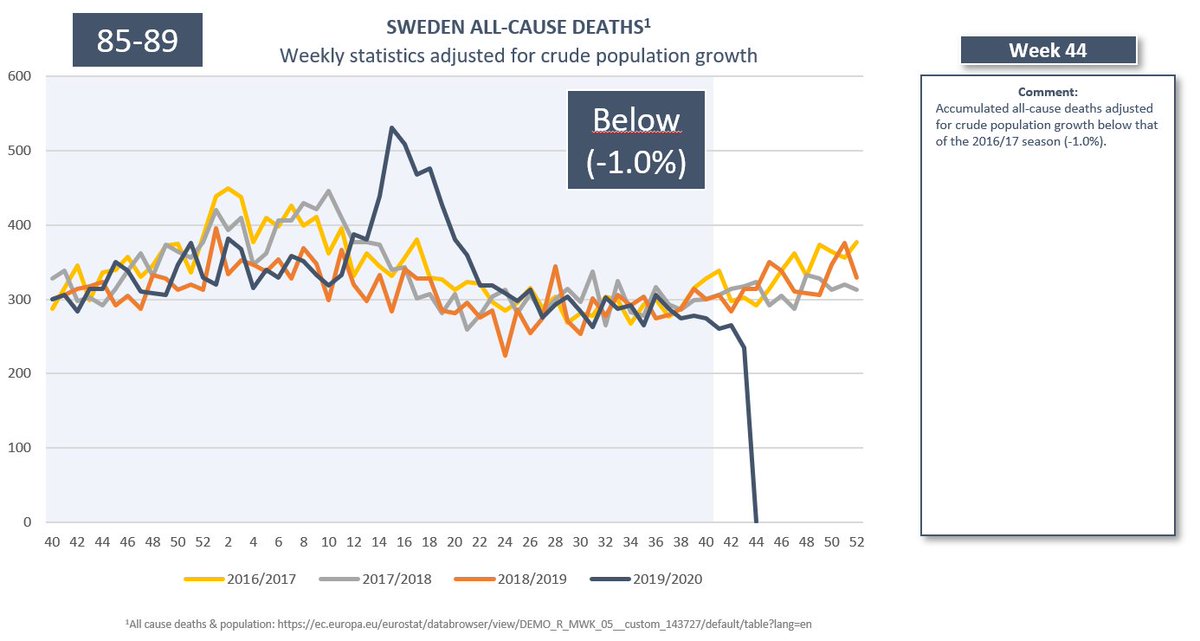
10/21 These 20 diagrams visualize the development of mortality in each age group over time. I am pressed to find any signal of something significant taking place season, with the exception perhaps of the 15-19 bracket.


11/21 Hereafter follows two diagrams for each age-bracket 70+. For <70 the weekly diagrams becomes highly erratic and it is difficult to discern any Covid19-effect, but for those interested I will keep adding the remaining age brackets as an appendix at the end of the thread.
12/21
90+ (-1.2% mortality vs 2016/17)
85-89 (-0.7% mortality vs 2016/17)
90+ (-1.2% mortality vs 2016/17)
85-89 (-0.7% mortality vs 2016/17)


13/21
80-84 (+1.8% mortality vs 2016/17)
75-79 (+1.1% mortality vs 2016/17)
80-84 (+1.8% mortality vs 2016/17)
75-79 (+1.1% mortality vs 2016/17)


14/21
70-74 (-10.7% mortality vs 2016/17)
70-74 (-10.7% mortality vs 2016/17)


15/21 Even among the elderly that are most susceptible to 2019/20 mortality does not stand out in a historical perspective, not even in the short term. In the few exceptions where mortality exceeded that of the 16/17 & 17/18 seasons the excess was 2% or less.
16/21 Sweden has recorded more than 6,000 deaths with Covid19. Yet all-cause mortality remains low in a historical perspective, and remarkably low for just about all age brackets below 75 years of age. Yet our focus is solely on the Covid19-related deaths.
17/21 I believe the health authorities should include reports on all-cause mortality in their communication. The pandemic is a global concern, and now that Sweden has unwillingly become the control group we have a responsibility to minimize the misinterpretations of our data.
18/21 I believe a return to a broader perspective on public health than simply counting Covid19-coded deaths is long overdue. Furthermore, it is not adequate to look at crude population adjusted all-cause mortality because, among other things, we have to account for demography.
19/21 The 1st full season with broad community spread of Covid19 has been concluded with low mortality relative to previous seasons. The 2nd season began in week 40. If history is any guide the winter weeks come with 100’s of more deaths than summer/fall, Covid19 or not.
20/21 (Please keep in mind that if we allocate deaths based on calendar year, we split the seasons of respiratory illness in half and mix up different dominant pathogens. This season we would also end up adding up the mortality of two respiratory illness seasons).
21/21 As always, I appreciate if anyone could point out potential shortcomings in my line of thought. If there is any good reason why we still haven’t shifted our attention to all-cause mortality I would love to hear it.
• • •
Missing some Tweet in this thread? You can try to
force a refresh