November 14 novembre
Weekly update for / Mise à jour hebdomadaire du Ontario/Quebec/Canada
Data is 100% public and official, and fully cited. / Les données sont 100% publiques et officielles.
#COVID19Canada #COVID19Ontario #COVID19Canada #covid19qc #covid19toronto
Weekly update for / Mise à jour hebdomadaire du Ontario/Quebec/Canada
Data is 100% public and official, and fully cited. / Les données sont 100% publiques et officielles.
#COVID19Canada #COVID19Ontario #COVID19Canada #covid19qc #covid19toronto


Canada - Covid-19 still presents a risk primarily to the elderly, not to children and hardly to working-age adults.
(n.b. Based on 2020 YTD data for Covid-19 - figures to be revised.)
(n.b. Based on 2020 YTD data for Covid-19 - figures to be revised.)

However, Covid-19 is often not a wholly distinct and separate cause of death as there are other medical conditions involved in many cases.
There are also cases in which it is not even a cause of death, but the individual had tested positive sometime prior to their death.
There are also cases in which it is not even a cause of death, but the individual had tested positive sometime prior to their death.

The average age of a death by or with covid-19 is higher than life expectancy.
Deaths among those over 80 account for 71.0% of deaths by/with covid-19, but only 51.2% of all deaths (all causes) in 2018.
Deaths among those over 80 account for 71.0% of deaths by/with covid-19, but only 51.2% of all deaths (all causes) in 2018.

Bear in mind that the risk of death will sadly always rise in line with one's advancing age.
In 2018, 9.2% of those in the over-80 age cohort passed away.
(n.b. Based on 2020 YTD data for Covid-19 - figures to be revised.)
In 2018, 9.2% of those in the over-80 age cohort passed away.
(n.b. Based on 2020 YTD data for Covid-19 - figures to be revised.)

If you are under 70, your risk of dying after being infected with SARS-CoV-2 is lower than your annual risk of death.
If you are over 70, your risk of dying after being infected is only slightly higher than your annual risk of death.
If you are over 70, your risk of dying after being infected is only slightly higher than your annual risk of death.

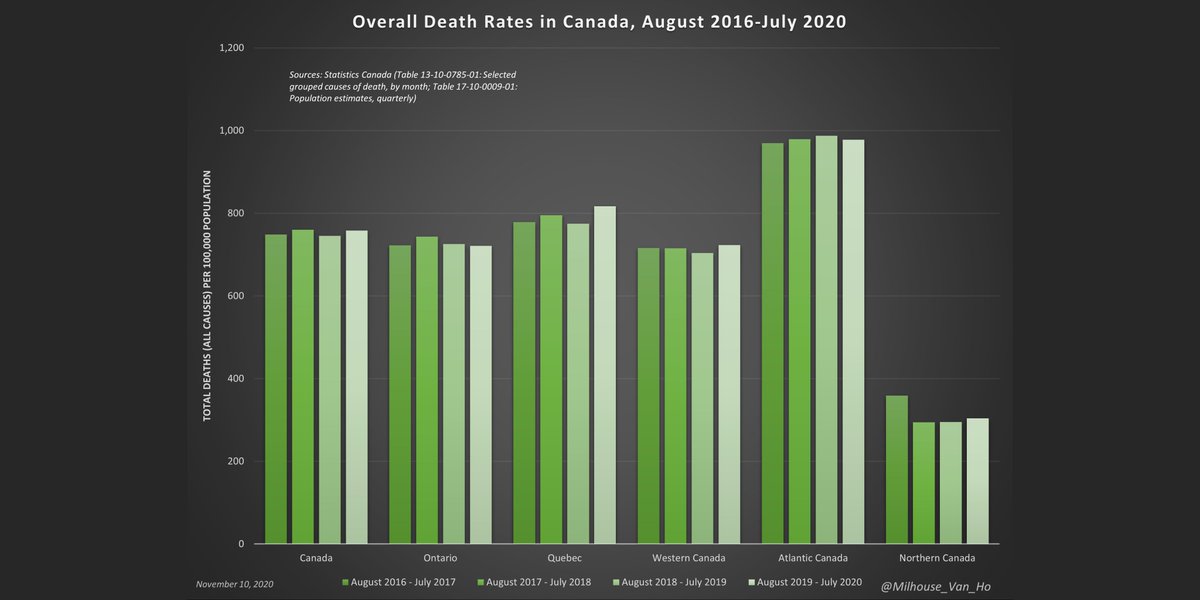
All-cause death rates in Canada, 2016 to 2020:
- Death rates in Aug 2019-July 2020 generally comparable to earlier periods
- Significantly more variation between regions than year-to-year within same region
- Death rates in Aug 2019-July 2020 generally comparable to earlier periods
- Significantly more variation between regions than year-to-year within same region

Overall deaths in Canada, 2016 to 2020:
- Ageing and growth of population may be biggest factors in modest year-over-year growth
- Ageing and growth of population may be biggest factors in modest year-over-year growth

Ontario (population: 14,745,040):
Total deaths by/with covid-19: 3,312 (225 deaths per every million people in ON or 0.02%)
38.8% of Canadian population but 30.6% of Canada deaths by/with covid-19
Total deaths by/with covid-19: 3,312 (225 deaths per every million people in ON or 0.02%)
38.8% of Canadian population but 30.6% of Canada deaths by/with covid-19

The two most important metrics to watch: deaths and ICU occupancy.
Ontario now reports:
- 106 in ICU
- 67 in ICU on a ventilator
Ontario now reports:
- 106 in ICU
- 67 in ICU on a ventilator

Ontario now reports:
- 106 in ICU
- 67 in ICU on a ventilator
- 106 in ICU
- 67 in ICU on a ventilator

Ontario now reports:
- 452 in hospital
- 106 in ICU
- 67 in ICU on a ventilator
- 452 in hospital
- 106 in ICU
- 67 in ICU on a ventilator

As data on daily new hospitalizations is not publicly available, this is the average daily net change in hospitalizations (ICU and non-ICU).

A note on hospitalization data: This may include those who have had a positive test result after being hospitalized for a different reason.

Covid-19 hospitalizations relative to influenza/pneumonia seasonal peak and trough.

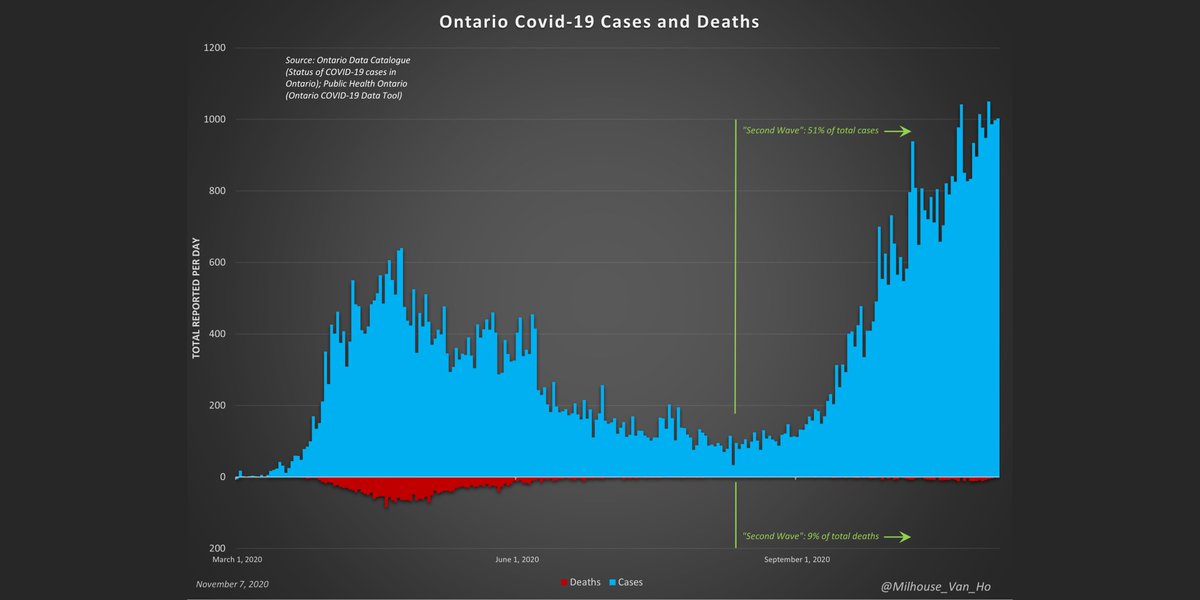
Ontario - The proportion of cases (positive test results) resulting in death (yellow line).

Ontario Fall/Winter season:
- Growth is not exponential
- May be able to declare a peak when average week-over-week growth reaches zero
- Growth is not exponential
- May be able to declare a peak when average week-over-week growth reaches zero

Deaths in Ontario, 2015-19, plus all deaths in 2020, Jan-July.
(n.b. Based on 2020 YTD data for Covid-19 - figures to be revised upward as needed.)
(n.b. Based on 2020 YTD data for Covid-19 - figures to be revised upward as needed.)

This is what 2020 might look like in Ontario month-to-month if:
1. All-cause deaths (excl. Covid-19) are in line with 2017-19 averages
2. All Covid-19 deaths are single-cause excess deaths
(n.b. Based on 2020 YTD data for Covid-19 - figures to be revised upward as needed.)
1. All-cause deaths (excl. Covid-19) are in line with 2017-19 averages
2. All Covid-19 deaths are single-cause excess deaths
(n.b. Based on 2020 YTD data for Covid-19 - figures to be revised upward as needed.)

Ontario deaths 2017-July 2020. Recent 2020 data may be subject to revision.

Covid-19 has been a crisis in Ontario's long-term care (LTC) system vs. among the general public.
(n.b. Based on 2020 YTD data for Covid-19 - figures to be revised upward as needed.)
(n.b. Based on 2020 YTD data for Covid-19 - figures to be revised upward as needed.)

This is the number of deaths by/with covid-19 per million people, among both:
1. the general public, outside the long-term care (LTC) system
2. long-term care (LTC) residents
(n.b. Based on 2020 YTD data for Covid-19 - figures to be revised upward as needed.)
1. the general public, outside the long-term care (LTC) system
2. long-term care (LTC) residents
(n.b. Based on 2020 YTD data for Covid-19 - figures to be revised upward as needed.)

Greater Toronto and Ottawa account for 50.3% of Ontario’s population but 79.5% of Ontario’s covid-19 deaths.
City of Toronto (population: 2,731,571 or 18.5% of Ontario):
Total deaths by/with covid-19: 1,438 (526 deaths per every million people in Toronto or 0.05%)
43.4% of Ontario deaths by/with covid-19
Total deaths by/with covid-19: 1,438 (526 deaths per every million people in Toronto or 0.05%)
43.4% of Ontario deaths by/with covid-19

Suburban Toronto (population: 3,685,945 or 25.0% of Ontario):
Total deaths by/with covid-19: 838 (227 deaths per every million people in the region or 0.02%)
25.3% of Ontario deaths by/with covid-19
Total deaths by/with covid-19: 838 (227 deaths per every million people in the region or 0.02%)
25.3% of Ontario deaths by/with covid-19

Halton Region:

Peel Region:

York Region:

Durham Region:

City of Ottawa (population: 1,006,210 or 6.8% of Ontario):
Total deaths by/with covid-19: 356 (354 deaths per every million people in Ottawa or 0.04%)
10.7% of Ontario deaths by/with covid-19
Total deaths by/with covid-19: 356 (354 deaths per every million people in Ottawa or 0.04%)
10.7% of Ontario deaths by/with covid-19

Québec (population: 8,552,362):
Nombre total de décès liés à Covid-19: 6 586 (770 décès pour chaque million de personnes au Québec ou 0,08%).
22,5% de la population canadienne, mais 60,8% des décès liés à la covid-19 au Canada.
Nombre total de décès liés à Covid-19: 6 586 (770 décès pour chaque million de personnes au Québec ou 0,08%).
22,5% de la population canadienne, mais 60,8% des décès liés à la covid-19 au Canada.

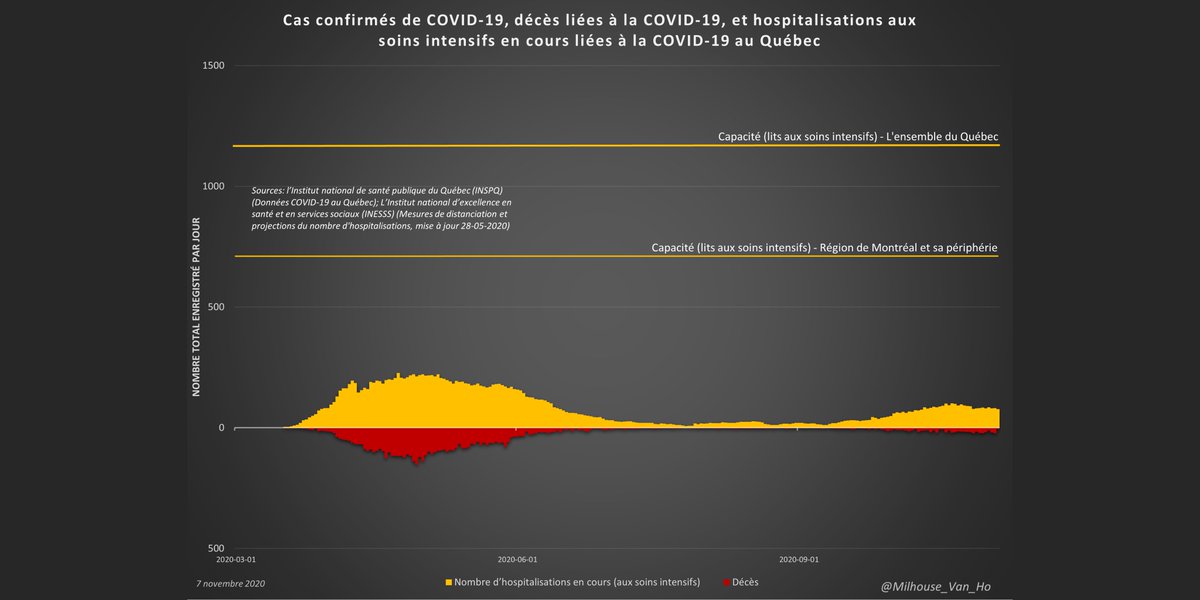
Les deux paramètres les plus importants à surveiller: les décès et hospitalisations aux soins intensifs.
85 hospitalisations aux soins intensifs en cours au Québec.
85 hospitalisations aux soins intensifs en cours au Québec.

85 hospitalisations aux soins intensifs en cours au Québec.

583 hospitalisations en cours au Québec:
- 85 aux soins intensifs
- 498 hors soins intensifs
- 85 aux soins intensifs
- 498 hors soins intensifs
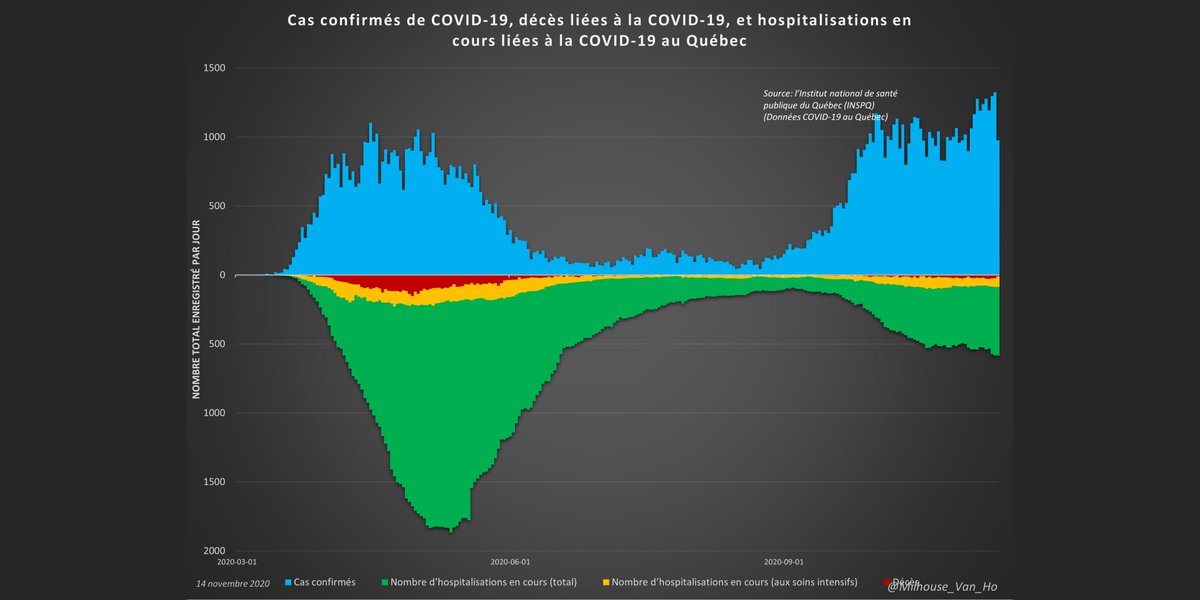
Nouvelles hospitalisations liées à la COVID-19 au Québec.

Québec - La proportion de cas entraînant la mort (ligne jaune).

Automne / hiver au Québec :
- La croissance n'est pas exponentielle
- On peut être en mesure de déclarer un pic quand croissance moyenne d'une semaine à l'autre s'approche de zéro
- La croissance n'est pas exponentielle
- On peut être en mesure de déclarer un pic quand croissance moyenne d'une semaine à l'autre s'approche de zéro

• • •
Missing some Tweet in this thread? You can try to
force a refresh