watching closely $silver next week

while $gold futures made a lower low, the $silver low of Sept 24 is still holding with over 11% higher

this is a serious anomaly in cycle trading, not seen since... August 2010

(1)
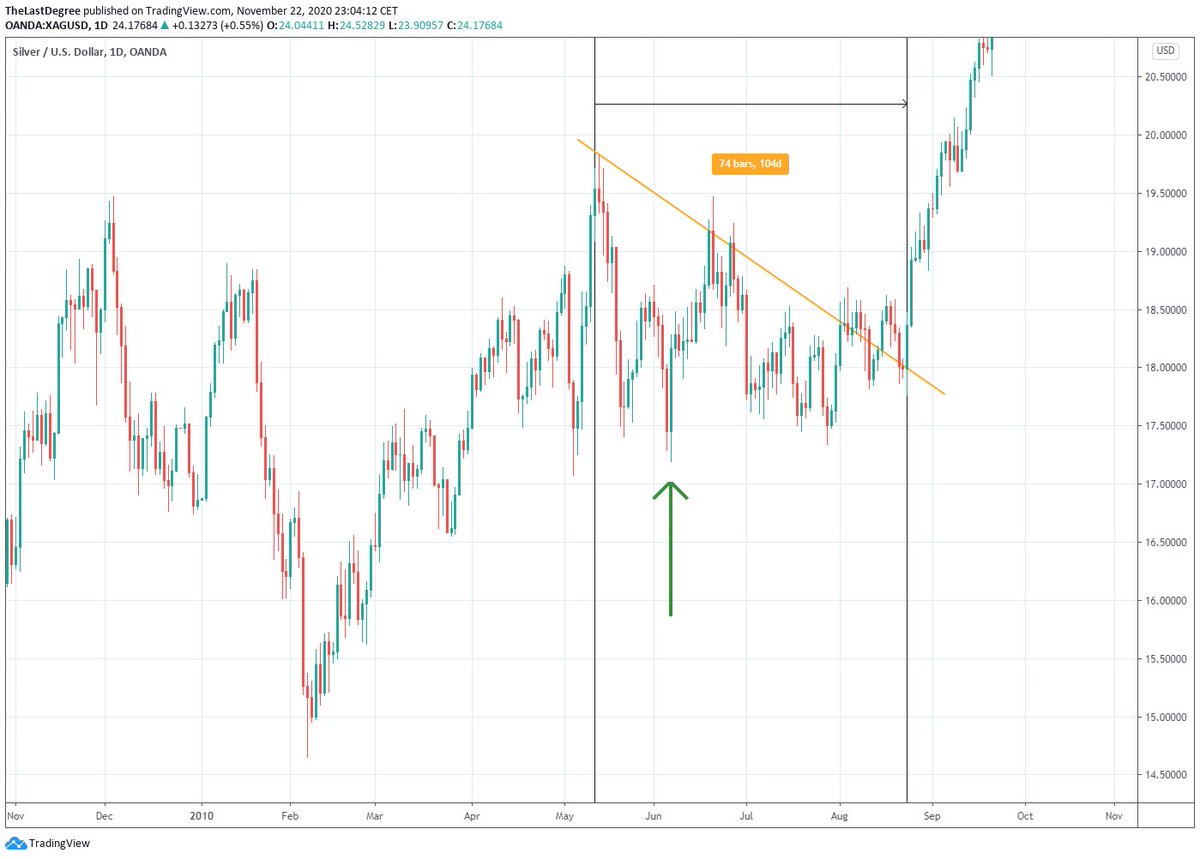
back then in august 2010 $silver found it's low fast after 16 days, while gold needed 34 (!) days more to set the final intermediate cycle low, all those 7 trading weeks $silver refused to fall... something was brewing.

August 24, an 8 month rally started adding 178%

(2)
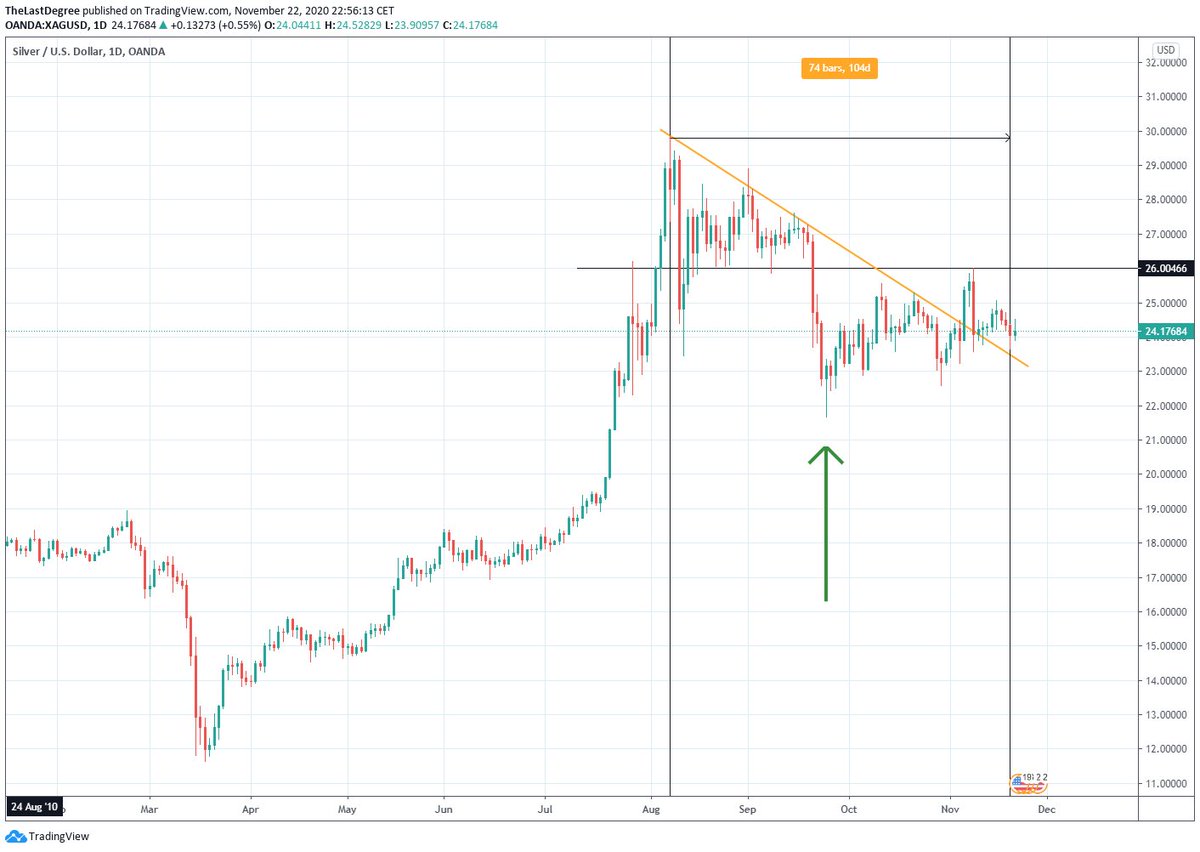
we have an almost identical setup now.

$Silver made it's low Sept 24, $gold made a new low more as 32 days later, while $silver kept grinding.

Something is brewing... again.
i forgot to add a small detail.

the consolidation back then took an annoying 104 days.

we are at 104 days. (4 - end)

• • •

Missing some Tweet in this thread? You can try to force a refresh
 

Keep Current with Gold Ventures

Gold Ventures Profile picture

Stay in touch and get notified when new unrolls are available from this author!

Read all threads

This Thread may be Removed Anytime!

PDF

Twitter may remove this content at anytime! Save it as PDF for later use!

Try unrolling a thread yourself!

how to unroll video
  1. Follow @ThreadReaderApp to mention us!

  2. From a Twitter thread mention us with a keyword "unroll"
@threadreaderapp unroll

Practice here first or read more on our help page!

More from @TheLastDegree

10 Nov
$XAUUSD #gold
since 2018, cycles (bottom to bottom 6 month cycles) have been running a LOT longer as in 2008-2011.

We now basicly had 2 corrective retraces, and 1 crash.

$gold always uses the same trick. over and over.

(1)
it always has FBO's from intermediate drawn trendlines.

this is 2019

look at the nice false break outs and the hard drops.
top to start impulse up, was 68bars (spring) and 77bars (fall)

(2)
look again at the fall 2019 - very similar
the ABC finished Nov 12 - i think we are 1day upfront (green arrow) - looking for a low with a break, as this will turn conservative traders even more bearish

the middle ground option

(3)
Read 4 tweets
25 Oct
for new followers, we are looking at 2.5 years of big compounding % in #gold #silver stocks, mostly in the juniors

since April 2019, we made 400% in the first 2 violent upwaves (sept 2019 & july 2020)

(1)
we started goldventures.org which outlines are our leveraged & leveraged PF in detail, no investment advice

currently long "movable" assets

8.6Million in 60 junior positions (90% silver, 10% gold)
1.2Million in leaps on Silver majors

(2)
and physical, now 85% silver (1000 kilo) and 15% gold

no uranium, no copper, no wheat, no BTC

while all commodities and crypto's will do great, we focus on monetary metals for 100%

(3)
Read 5 tweets
29 Sep
what's coming (1)
The last few months, we broke ath’s.

We saw some press articles popping on SI & GC, also in very mainstream papers.

We got first awareness.

on Belgium public national radio: you lost 13% on savings accounts over 10Y

reactions: the move is probably done
what's coming (2) When silver breaks 30 next, and gold goes beyond ath’s:

FOMO will kick in on a very different level.

Momentum will mount to another scale. wave 5 scale, which is still missing and the only reason I have my seat early

I am expecting a major first top coming
what's coming (3)

after this 2 year run, bigger than we might imagine.

Most expect a longer consolidation, but expect it fast & not so orderly.
It’s doesn’t matter, I am positioned for both.

made 400% in the last 15months, expecting the same next but in HALF the time
Read 5 tweets
25 Sep
$GSR Gold to Silver fibonacci madness

three legs down - every leg had a clear retrace to 0.382 (last had a spike to 0.5) - we are ready Image
$GSR Gold to Silver fibonacci madness

structure is valid to spot bottoms

unfortunately measuring the extensions to find tops upfront i find nothing. Image
$GSR top spotter March-August PM leg
ultimate targets where defined by the first 1-2 down Image
Read 4 tweets
12 Sep
THE chart of the WE (1)

if we are heading for high inflation due to monetary policy, without economic growth, we should dig deeper on the $gold cycles of the 70ties.

and not, what most analysts are doing, expecting the same cycle behaviour of the 2001-2011 bull market
THE chart of the WE (2)

during the 2001-2011, we had clear +-6 month intermediate cycles. (@badcharts) showed it in a podcast 9 months ago. 3-5 monthly white candles followed by 1-3 red candles, repeating forever.

or 12-20 upweeks, 4-12 downweeks.
THE chart of the WE (3)

Now look at this. #gold trading behaviour during 1976-1980

4 years long, we NEVER exceeded 8 correction weeks.
that's massive.
don't get left behind guys😉

retweet this log chart.
Read 5 tweets
23 Aug
Tradeplan/Bias: PM are hugely bullish, currently in consolidation/correction mode.

My main models are starting to 'line up'.

i have been sleepless last few days putting all variables into a tradeplan that covers different scenario's.
Any drop to $GDX 37-39 would cover my hedges. (all together)

i see a 90% probabilty we get further corrective action, only the path (direct, fast) or pennant (longer fustrating) is very troubled.

(2)
My preferred scenario would be a fast drop scenario, with a flat month after and a soft retest on lower volatility. That would align all methods.

Correction in price directly, correction in time after.
Metals could trade slightly lower, while miners find bottoms next 1-2 weeks
Read 8 tweets

Did Thread Reader help you today?

Support us! We are indie developers!


This site is made by just two indie developers on a laptop doing marketing, support and development! Read more about the story.

Become a Premium Member ($3/month or $30/year) and get exclusive features!

Become Premium

Too expensive? Make a small donation by buying us coffee ($5) or help with server cost ($10)

Donate via Paypal Become our Patreon

Thank you for your support!

Follow Us on Twitter!