🚨🚨🚨
A slew of recent data is consistent with slow or even negative jobs growth in November. A quick thread.
November is typically a month when we expect raw, non-seasonally-adjusted employment data to *strengthen* (due, among other things, to hiring up for the holidays).

So when the unadjusted data is weakening or shrinking in November, that's an especially bad sign.
Data from Homebase, a private scheduling firm, suggest shrinking employment b/t mid-Oct and mid-Nov. Kronos, a different firm, shows slightly positive but weak growth.

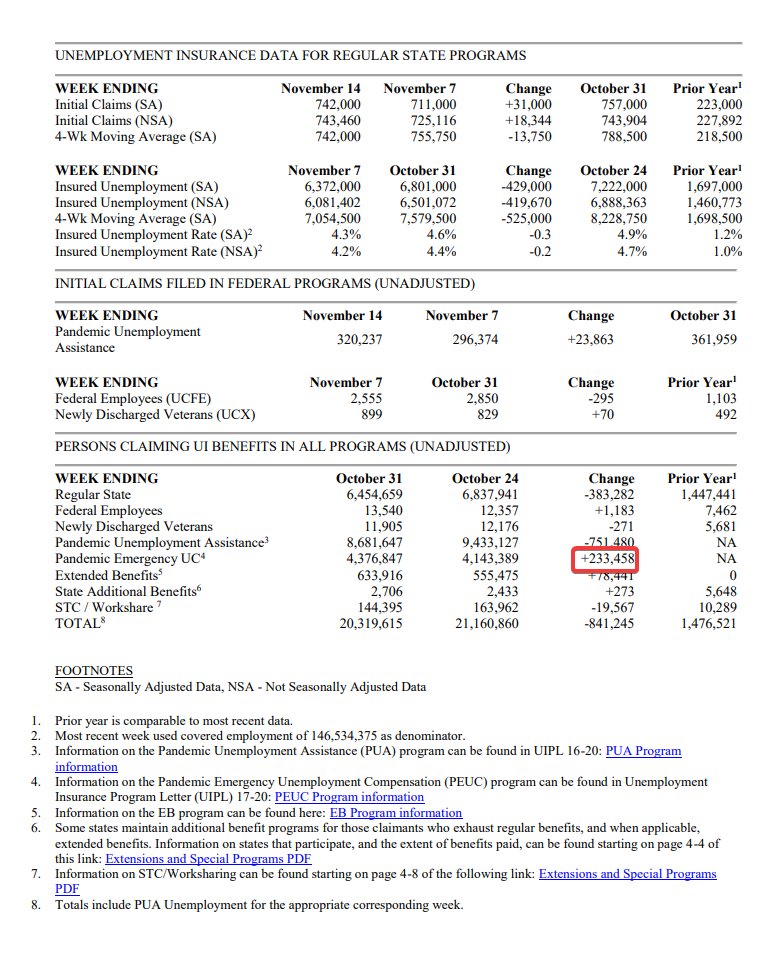
Both, in tandem w/ UI claims, are consistent with -143K jobs in Nov not-seasonally-adjusted, or -461K adjusted.
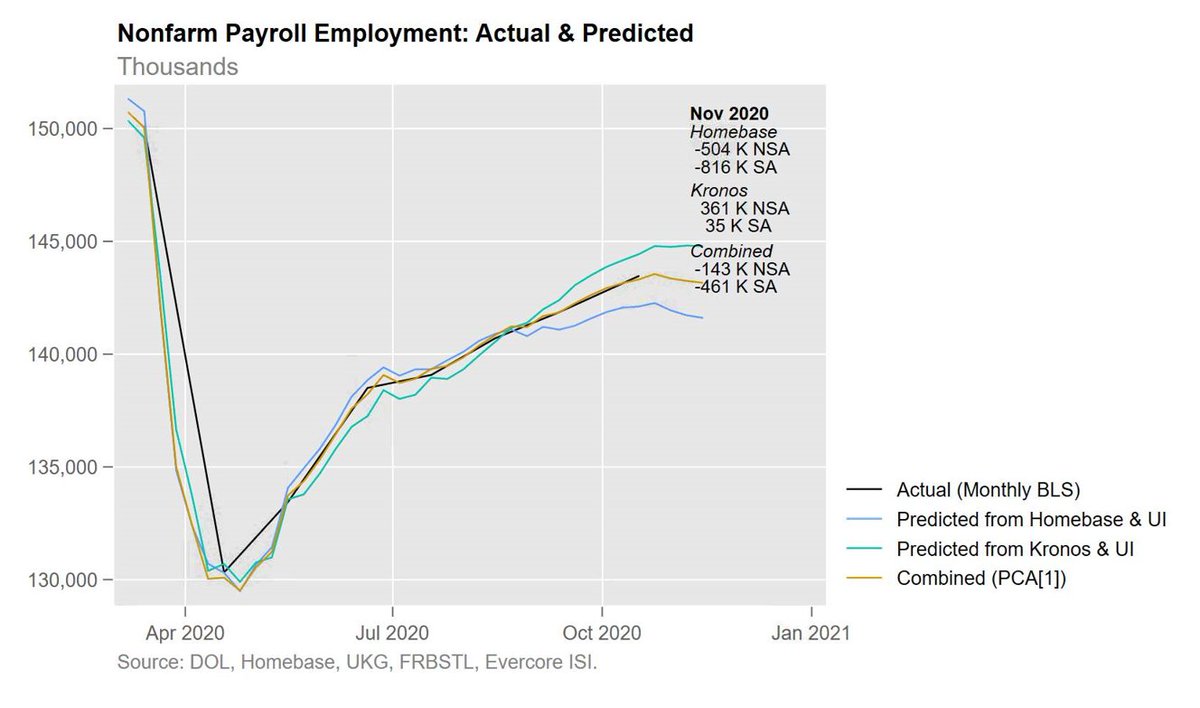
The Homebase and Kronos data sometimes get revised week-to-week, however, so these estimates could shift. The revisions have tended to be modest.
The @uscensusbureau Household Pulse Survey meanwhile is showing a -1.8 percentage point decline in the employment-to-population ratio over the last 4 weeks. That's the equivalent of -4.5 million fewer workers, not-seasonally-adjusted.

The HPS has had large misses before however.
We're also beginning to see some signs of slowdown in states with more recent COVID surges, such as through lower mobility and soggier Homebase employment, though earlier Spring Peak states are also showing signs of decline.
So at this point, we have several data sources--Homebase, Kronos, the HPS, and mobility data--pointing to a weak or negative Nov labor market.

Some might firm a bit in the weeks ahead with revisions (though they might weaken too).

But what there is so far doesn't bode well.
I lay out a few more caveats and go into two data sources that are pointing the other direction in this companion thread.

• • •

Missing some Tweet in this thread? You can try to force a refresh
 

Keep Current with Ernie Tedeschi

Ernie Tedeschi Profile picture

Stay in touch and get notified when new unrolls are available from this author!

Read all threads

This Thread may be Removed Anytime!

PDF

Twitter may remove this content at anytime! Save it as PDF for later use!

Try unrolling a thread yourself!

how to unroll video
  1. Follow @ThreadReaderApp to mention us!

  2. From a Twitter thread mention us with a keyword "unroll"
@threadreaderapp unroll

Practice here first or read more on our help page!

More from @ernietedeschi

19 Nov
Initial claims rise modestly week over week, were ~1.1 million last week.
The recent declines in regular UI recipients, properly including the extended PEUC and EB programs, may be slowing.
And to punctuate that point: ~230,000 workers looked like they left regular state UI at the end of October, but actually just exhausted their regular benefits and transferred to the federal extended PEUC program.
Read 4 tweets
18 Nov
On the one hand, the US recovery so far has been durably positive & modest

On the other hand, b/t the COVID surge, the cold winter weather, exhausted household savings, the end of moratoria on student loans/foreclosures/evictions, & UI expirations, we're piling on a lot of risks
And add on the risks of business closures & state/local cuts. There's a lot that can hurt us economically between now and wide vaccine distribution.
The wrong question to ask is whether the recovery is "self-sustaining" without further fiscal support. I am less confident in this assessment now, but it's still quite possible that if we got no fiscal package most economic data would continue coming in north of zero.

Instead...
Read 8 tweets
12 Nov
The good news is that the rate in which employed workers are going directly into *permanent* layoff has fallen, though is still elevated [left].

The bad news is that the rate at which already-nonemployed workers are *becoming* permanent layoffs is high and rising [right]. ImageImage
Meanwhile, hourly wage growth among workers keeping their jobs is stable [L], but weekly wage growth has fallen [R], a sign that employed workers are getting fewer hours. ImageImage
Read 4 tweets
12 Nov
The benefit cliff on December 31 is an economic setback when we least need one -- the winter months when businesses in many of the areas of the country will have a harder time staying open -- not to mention devastating for the affected workers.
Unlike the 7/31 expiration of the emergency $600/week FPUC, which was larger in aggregate dollar terms than this cliff, the 12/31 cliff will cut a deeper wound, because for many workers they won't get *any* aid after expiration; they still got base benefits when the FPUC expired.
It's less likely too that prior savings will be there to sustain the spending of unemployed workers; they've been drawing down their savings since the expiration of the $300/week LWA in mid-September. Many workers are likely to have exhausted their pandemic savings by New Year's.
Read 4 tweets
8 Oct
We're past the point where the problem is liquidity -- muni market frictions appear to have subsided, & the Fed has a credit facility aimed at regional governments.

The problem is that state & local revenue bases are collapsing & they legally have to balance their budgets.
The risks we face now actually played out in 2009 & 2010: state & local governments had to make deep cuts (purple bar below in the @BrookingsEcon measure), which became a drag on the then-nascent economic recovery.
If anything, the moral hazard argument around state & local aid cuts the *other* way from how opponents often make it:

The states that did the *right* thing with COVID restrictions likely saw deeper revenue hits, & that may be making them more hesitant to do the right thing now.
Read 5 tweets
6 Oct
@mikemadowitz and I had a productive conversation about this data.

It turns out, the disparity in marriage employment *counts* is mostly an artifact of something else going on in the household survey entirely. /1
Namely, look at what's happened to the number of married men and women reported in the household survey during the pandemic: a rapid rise in February, and then a fall after June. /2 Image
So a great deal of the declines in employment *counts* for married men and women in the household survey is explained by the declines in just the number of married people the survey shows in the first place. /3
Read 15 tweets

Did Thread Reader help you today?

Support us! We are indie developers!


This site is made by just two indie developers on a laptop doing marketing, support and development! Read more about the story.

Become a Premium Member ($3/month or $30/year) and get exclusive features!

Become Premium

Too expensive? Make a small donation by buying us coffee ($5) or help with server cost ($10)

Donate via Paypal Become our Patreon

Thank you for your support!

Follow Us on Twitter!