1. To stay in the game all option market-makers must actively manage their greeks. One of the challenging tasks is aggregating the portfolio vega across different maturities. While we can aggregate the delta/gamma/theta fairly easily, vega is trickier to manage. Let’s see why…
2. Suppose we’re a market-maker trading on @tradeparadigm with a book of three options:

Option A: Maturity = 30 days
- Short 100 contracts
- Vega = 3

Option B: Maturity = 60 days
- Long 50 contracts
- Vega = 6

Option C: Maturity = 90 days
- Long 50 contracts
- Vega = 10
3. An initial (but likely incorrect) approach to aggregate the portfolio vega exposure would be:

- Option A: -100 x 3 = -300
- Option B: 50 x 6 = + 300
- Option C: 50 x 10 = + 500

Portfolio Vega = A + B + C = +500
4. We usually can't simply add up the vegas across different maturities because of the way implied volatility (IV) moves across different time periods. As shown below, shorter-dated IV can move significantly more than mid-term and long-term IV. Image
5. Simply adding the vegas across all maturities implies the short-term IV will move just as much as the mid-term and long-term IV. Generally this is not true as IV does not move in a parallel manner across different time-horizons.
6. One potential way to address this problem was noted in @EGHaug's great paper on net weighted vega (NWV) exposure. You can read it here: espenhaug.com/Haug1993.pdf
7. With this approach we can adjust our vegas w.r.t the vol of vol and vol correlation over the option's maturity. This approach assumes that historical vol and correlation relationships remain relatively the same throughout time. Image
8. By normalizing the option vegas with this approach, we can now add up the net vega exposure across different maturities (because now they have been adjusted for the non-parallel shifts in the IV term structure).
9. Here’s an example: imagine we’re a market-maker with a random position size (ranging from -100 to +100) in every single BTC option on @DeribitExchange. We only look at options with maturities > 10 days as the relationships get too noisy below this value.
10. Using the NWV approach we can calculate the normalized vega risk for each option and sum all of our exposures across the entire portfolio. We can see the overall ending values are quite different. Image
11. Because our position sizes are randomly assigned, we can run 10,000 simulations to visualize the relationship between the two. Here we plot the normal vega vs. NWV (used log because it's easier to visualize). We can see the differences can be quite large. Image
12. We can also look at the distribution of the two approaches. In this case, we could make a compelling argument that the normal vega approach under-states the overall vega exposure vs. the NWV approach. Image
13. That's why it's crucial to get this right especially if you're a vol-trader with exposures across multiple option maturities!
14. What do you guys think: @saah1lk, @OrthoTrading, @darshanvaidya , @ConvexMonster @kyled116, @BitcoinMises, @MMKustermann? How would you manage vega for markets with large jumps such as crypto?

• • •

Missing some Tweet in this thread? You can try to force a refresh
 

Keep Current with Samneet Chepal

Samneet Chepal Profile picture

Stay in touch and get notified when new unrolls are available from this author!

Read all threads

This Thread may be Removed Anytime!

PDF

Twitter may remove this content at anytime! Save it as PDF for later use!

Try unrolling a thread yourself!

how to unroll video
  1. Follow @ThreadReaderApp to mention us!

  2. From a Twitter thread mention us with a keyword "unroll"
@threadreaderapp unroll

Practice here first or read more on our help page!

More from @samchepal

19 Dec
1. The recent rise in BTC spot and implied volatility has led me to re-read @SinclairEuan's book, “Positional Options Trading”. I found the chapter on volatility positions quite interesting with some useful parallels for crypto vol markets.
2. If we're shorting IV, ideally we want a strike with the largest vol premium. Although deep OTM puts tend to have the highest IV, we need to sell a lot of these options b/c their vega is low. As a result, selling these teeny options in size based only on high IV is dangerous.
3. Another method is to “sell options with the greatest dollar premium over what the option would be worth if it were priced with ATM IV". This allows us to quantify how much of the premium in dollars we are collecting in terms of skew.
Read 10 tweets
14 Oct
1. Huge thanks to @digitalbrock and his team at @Round_Block for supporting me with some very useful #BTC @CMEGroup options data for research! I've been focused mostly on @DeribitExchange in the past but CME seems to target institutional folks which should lead to new insights.
2. Given I had access to historical time-series options data, one of my first thoughts was to implement @SqueezeMetrics's paper on Gamma Exposure (GEX) and see whether this metric is relevant to crypto markets. This will be a longer and more involved post!
squeezemetrics.com/download/white…
3. Market-makers generally do not like to have exposure to the price of the underlying as their business is focused on collecting the bid-ask spread. To stay in business, option market-makers hedge their delta exposures when buying or selling options.
Read 24 tweets
5 Oct
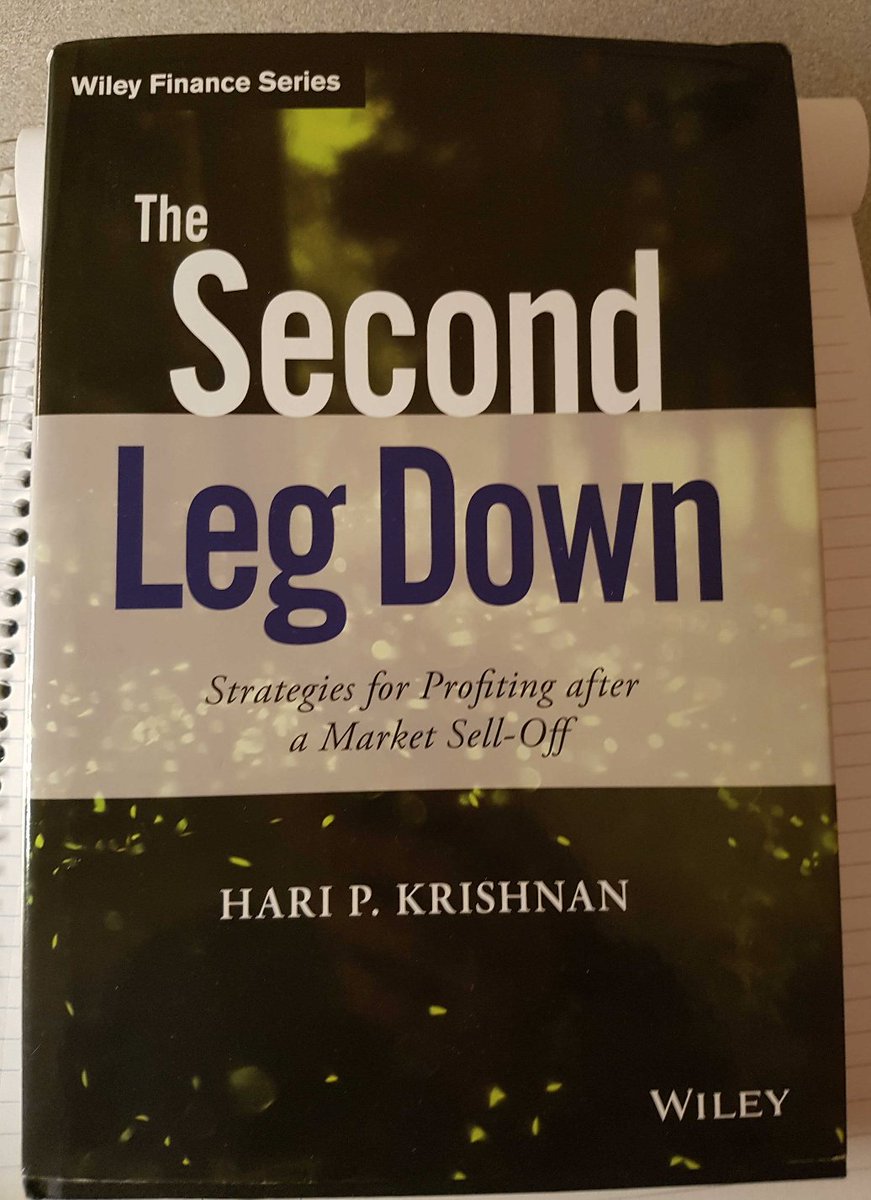
1. This is one of the best resources I've come across for implementing emergency hedges using options in a cost effective manner. Now more than ever I think Hari's wisdom can be applied to manage risk within the crypto options space especially before things get interesting...
2. As @zackvoell mentioned in this note, #BTC 180 day rolling realized vol is at nearly a 2 year low. Vol has several characteristic features across every market - one of them is the concept of mean-reversion.
3. We may not know when, but vol tends to go back to its average long-term value. Since realized vol is so low right now, I'd be risk-averse to place large short vol trades. It feels as though things have quieted down a little too much - seems a bit off.
Read 16 tweets
2 Oct
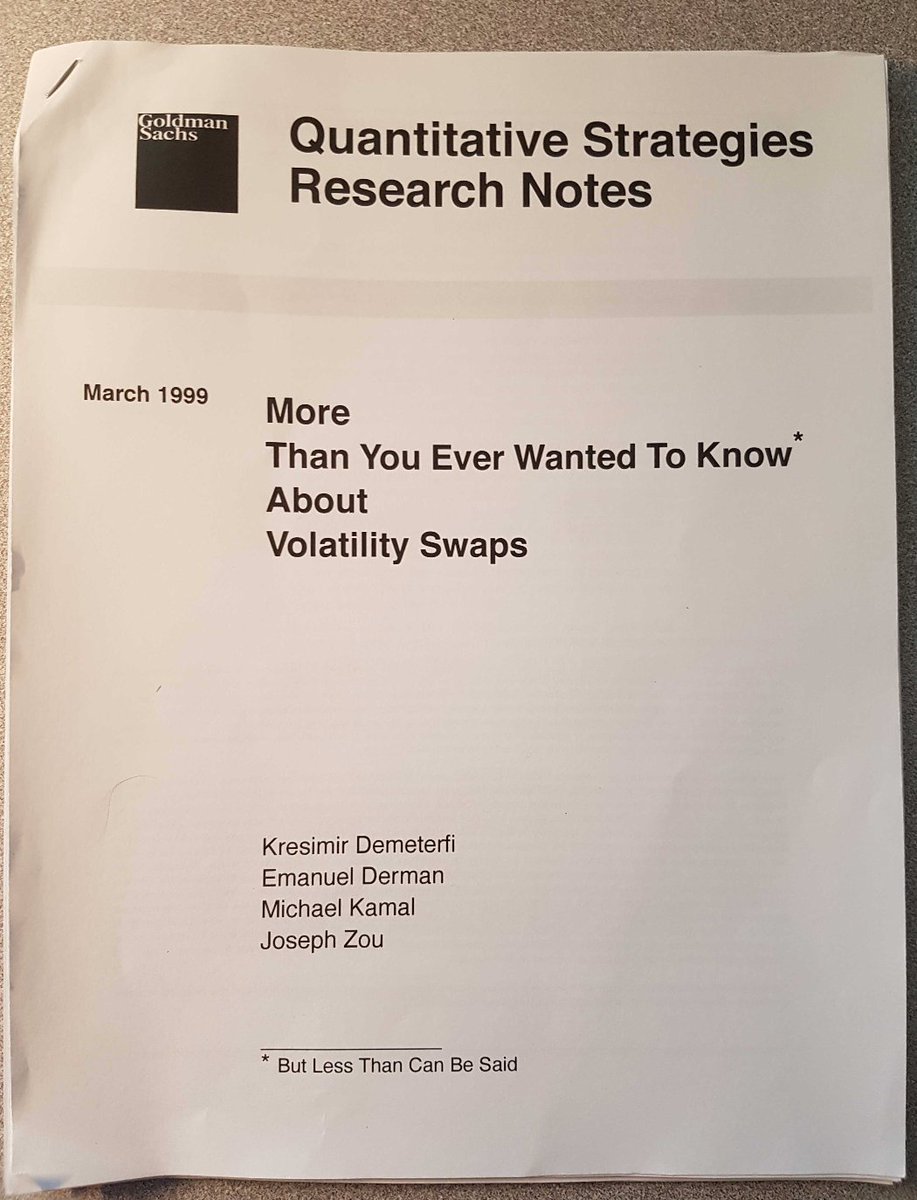
1/ Learned a lot about variance swaps by reading through @EmanuelDerman's awesome paper. This inspired me to replicate a variance swap term structure for #BTC by using options data from @DeribitExchange. Image
2/ During my research I read about the first #BTC variance swap between @GSR_io and @BlockTower which occurred in the summer of 2019. Given the lack of public data for these swaps, the only real way to get a decent price estimate is to use a replicating portfolio of options.
3/ These variance swaps allow for traders to make outright bets on volatility^2. Instead of using options (ie: straddles), with these products there is no need to delta-hedge. The payoff is as follows:

(Realized Variance - Strike Variance) x Notional
Read 6 tweets
1 Oct
1/ Spent some time exploring the market implied distribution for #BTC options trading on @DeribitExchange. This was a bit trickier than I expected but learned some interesting things along the way...
2/ I came across a closed form risk-neutral probability density (RND) solution from @EGHaug's detailed book on options pricing. I was surprised to learn that the RND is just the 2nd derivative of the option value wrt strike price. For those interested below is the formula. Image
3/ The limited number of options for #BTC Dec-25-2020 required me to linearly interpolate the IV across theoretical strikes. Instead of just 18 actual IV values, now we are able to estimate nearly 3,000+ IV data points as shown below. This will allow for a smoother RND plot. Image
Read 7 tweets
30 Sep
#BTC daily returns are not normal! After running a Gaussian kernel density estimation and comparing this to its respective normal distribution, we can see that #BTC has a lot of kurtosis as shown by the "peakedness" near the centre. Image
Also, Black Thursday and other extreme events occur much more often than a normal distribution would predict. This can be seen in the weight of the tails of the estimated distribution.
Theoretically, if the market is pricing in a normal dist the trader can make money here.

As a recap, the estimated dist has a greater probability of staying in the centre than the normal dist would predict. Also, the estimated dist has fatter tails than the normal dist.
Read 8 tweets

Did Thread Reader help you today?

Support us! We are indie developers!


This site is made by just two indie developers on a laptop doing marketing, support and development! Read more about the story.

Become a Premium Member ($3/month or $30/year) and get exclusive features!

Become Premium

Too expensive? Make a small donation by buying us coffee ($5) or help with server cost ($10)

Donate via Paypal Become our Patreon

Thank you for your support!

Follow Us on Twitter!