🚨⚡️FULL TECHNICAL REPORT RELEASED⚡️🚨
Today, we have released our full technical report on the "Why Local Solar and Storage Costs Less". Two weeks ago, we released the main findings: savings of $473 billion when co-optimizing distribution. This released provides more details!
Today, we have released our full technical report on the "Why Local Solar and Storage Costs Less". Two weeks ago, we released the main findings: savings of $473 billion when co-optimizing distribution. This released provides more details!
The report, ES, summary presentation, and spreadsheet can all be found on our website: vibrantcleanenergy.com/media/reports/ #energytwitter #cleanelectricity

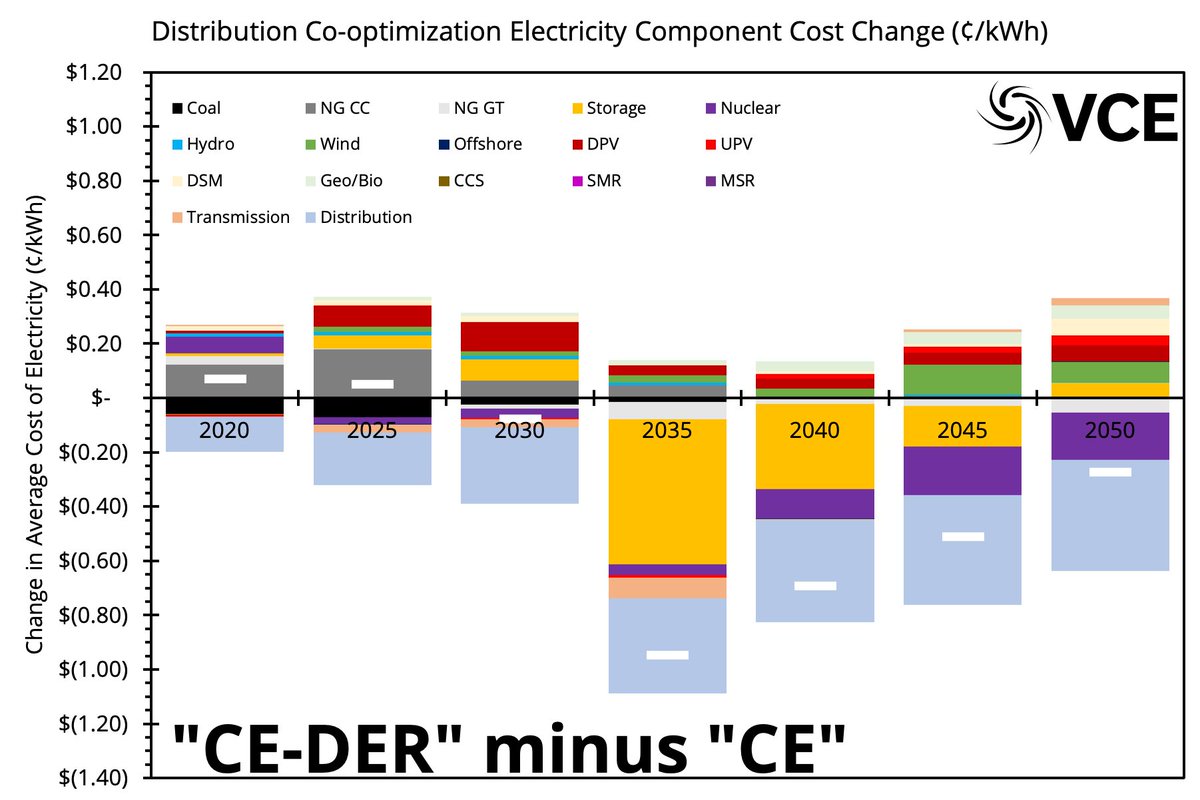
The full technical report shows that the cost savings comes from lower distribution spending and higher utilization of variable renewables. The additional costs of local solar and storage are much lower than the benefits unlocked. #energytwitter

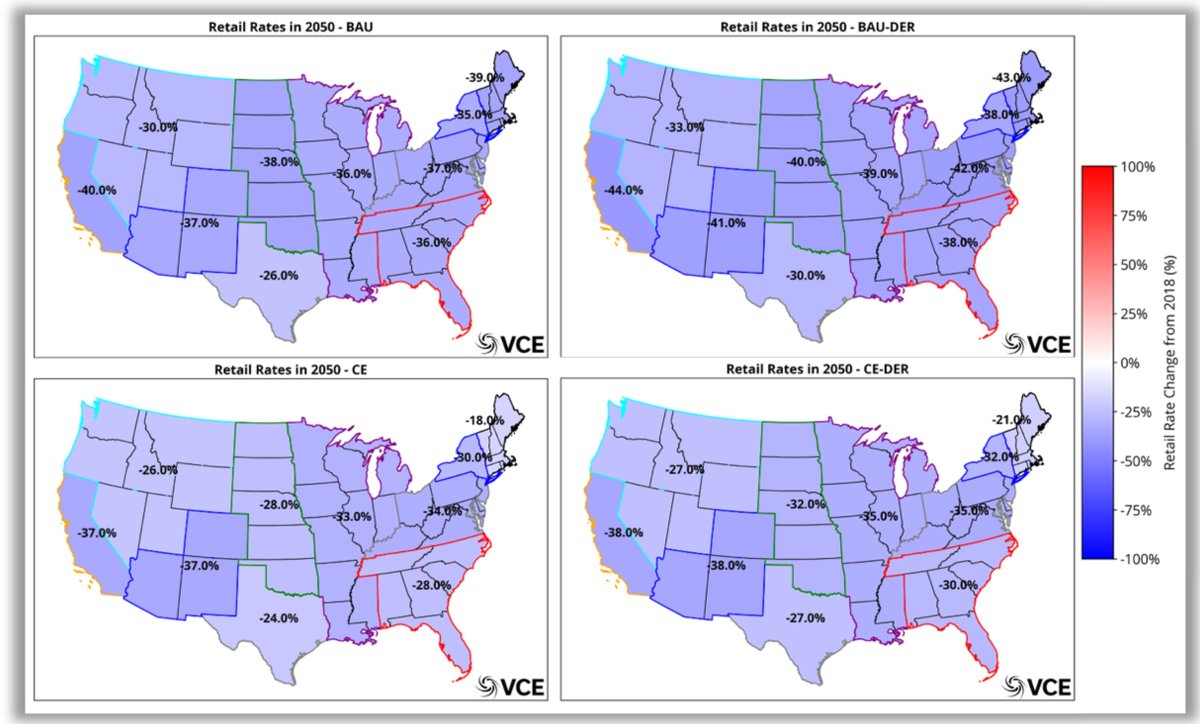
The modeling shows that retail rates could drop for all customers across the US. The full technical report shows this by region in the US.
When the US shifts from dirty fossil fuels as the future and to clean electricity mandates, the co-optimization enables a lower-cost solution and the spending changes is effectively: less on coal, gas and distribution; more on all clean resources!

Full time jobs in the electricity sector double in every state by 2050. With some states increasing even more. The distribution co-optimized scenarios has more jobs and they are more distributed than the non co-optimized counterparts.

The modeling does not replace utility-scale VREs with local ones. It replaced coal, natural gas and nuclear with MORE utility-scale wind and solar (for CES) and local solar and storage. Note utility storage is divided into distr & utility when distribution co-optimization occurs.

The modeling evolves the US system from 2018 through 2050. It does this in a myopic manner and makes decisions that are optimal at each investment period. This means it tries to predict without perfect foresight and will try to use existing infrastructure if those costs are sunk
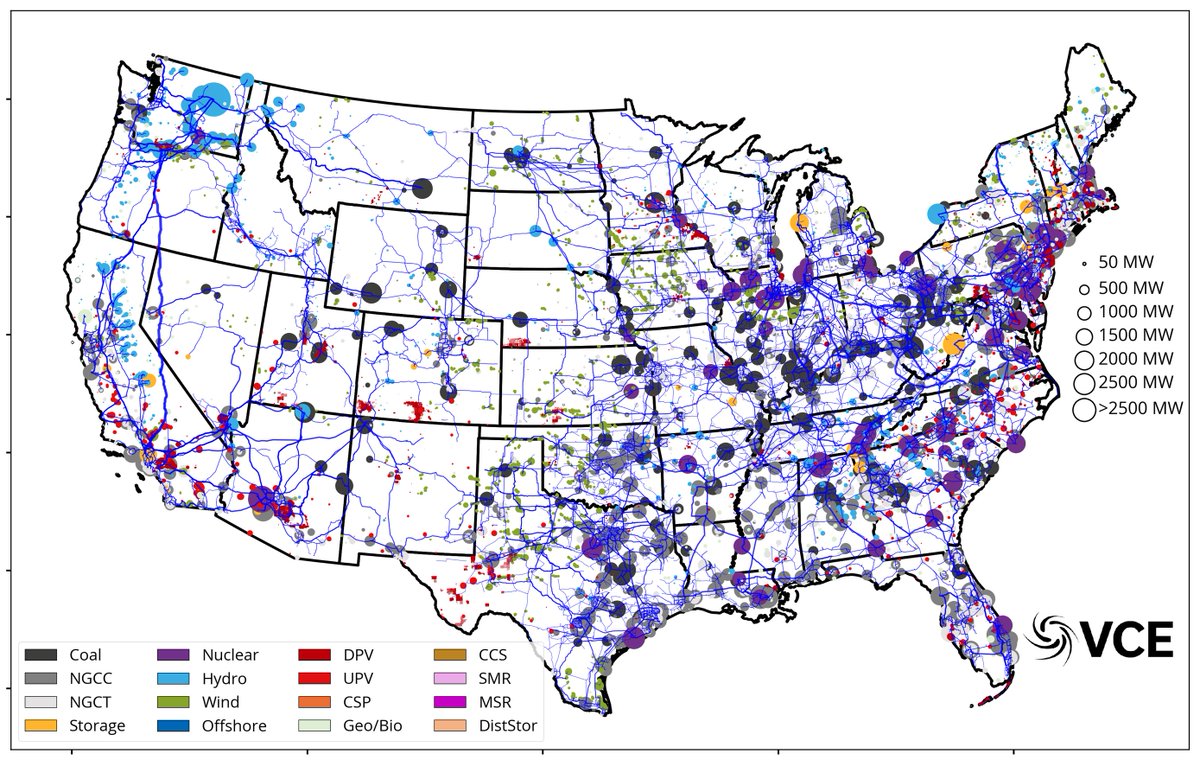


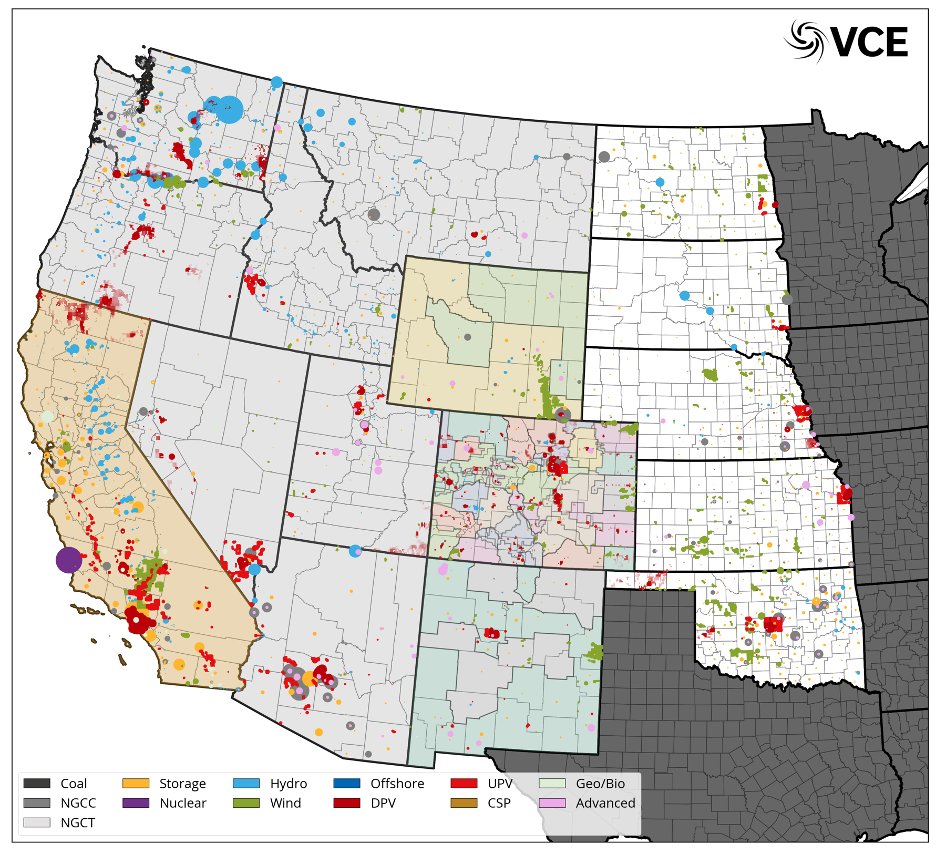
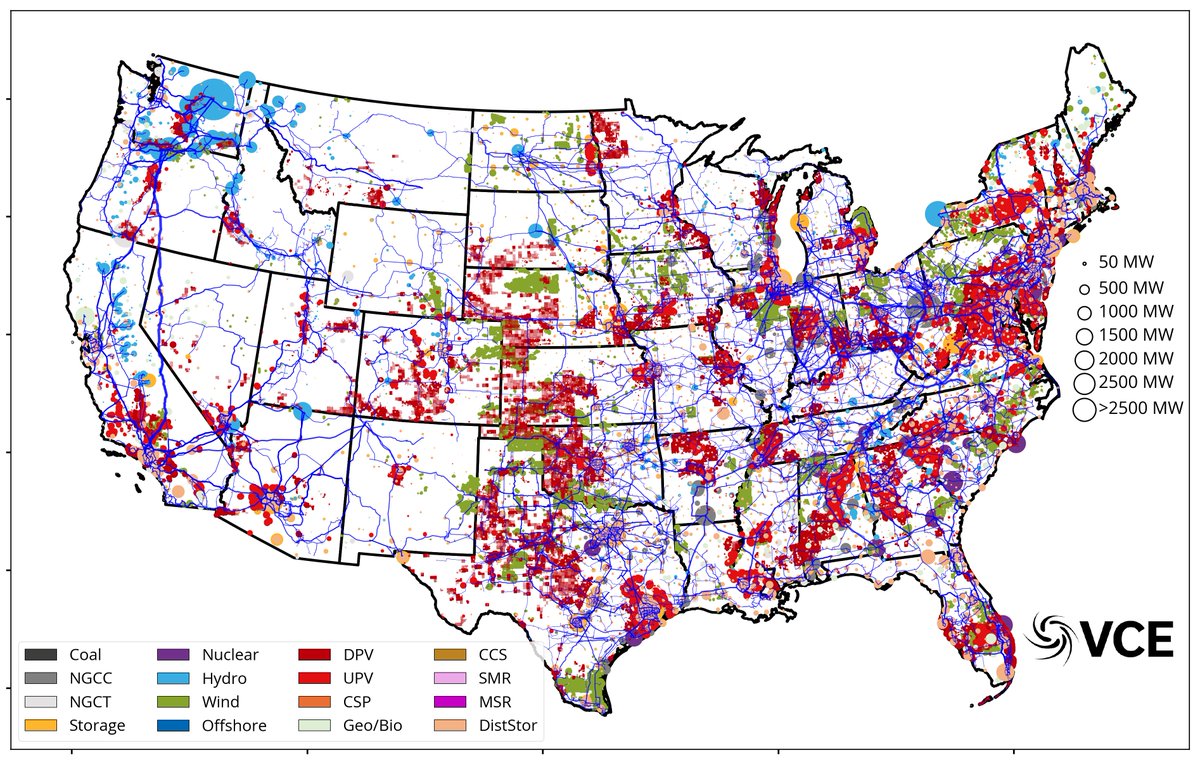
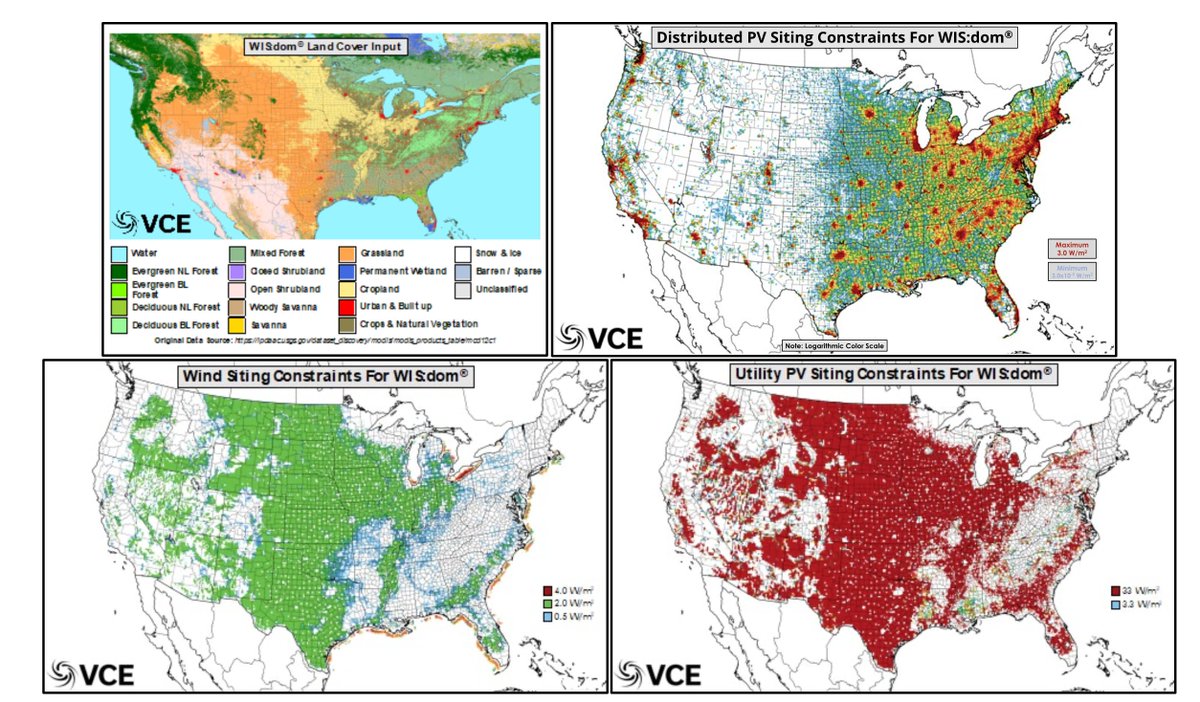
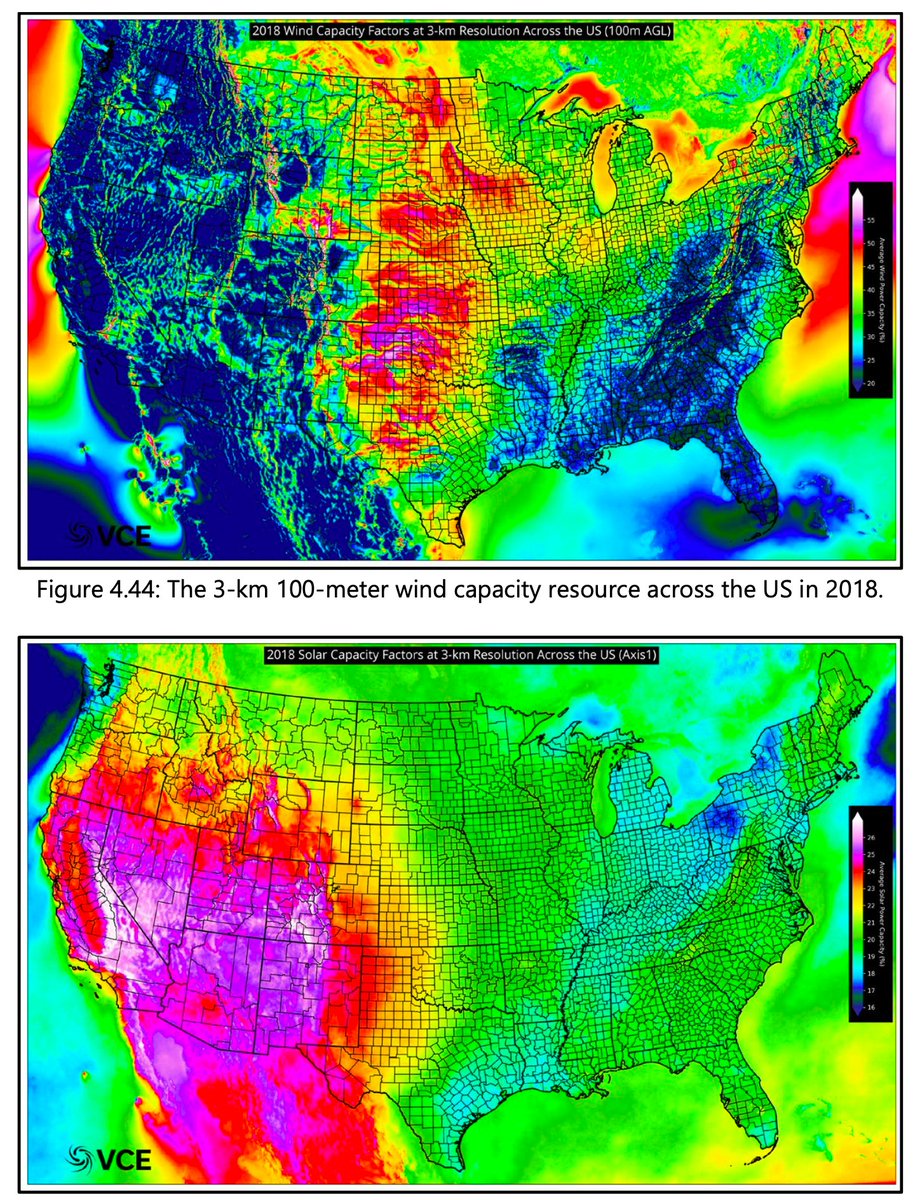
When the model is considering siting, we use our 3-km inputs to the WIS:dom®-P model. These have been heavily analyzed for how appropriate the siting is from a technical perspective. This is described in the report.
Storage behaves very differently on the distribution and utility grids. They also behave differently over seasons. These show that the value of the two resources are distinct and are not replacements for one another. They provide unique values for the whole system.


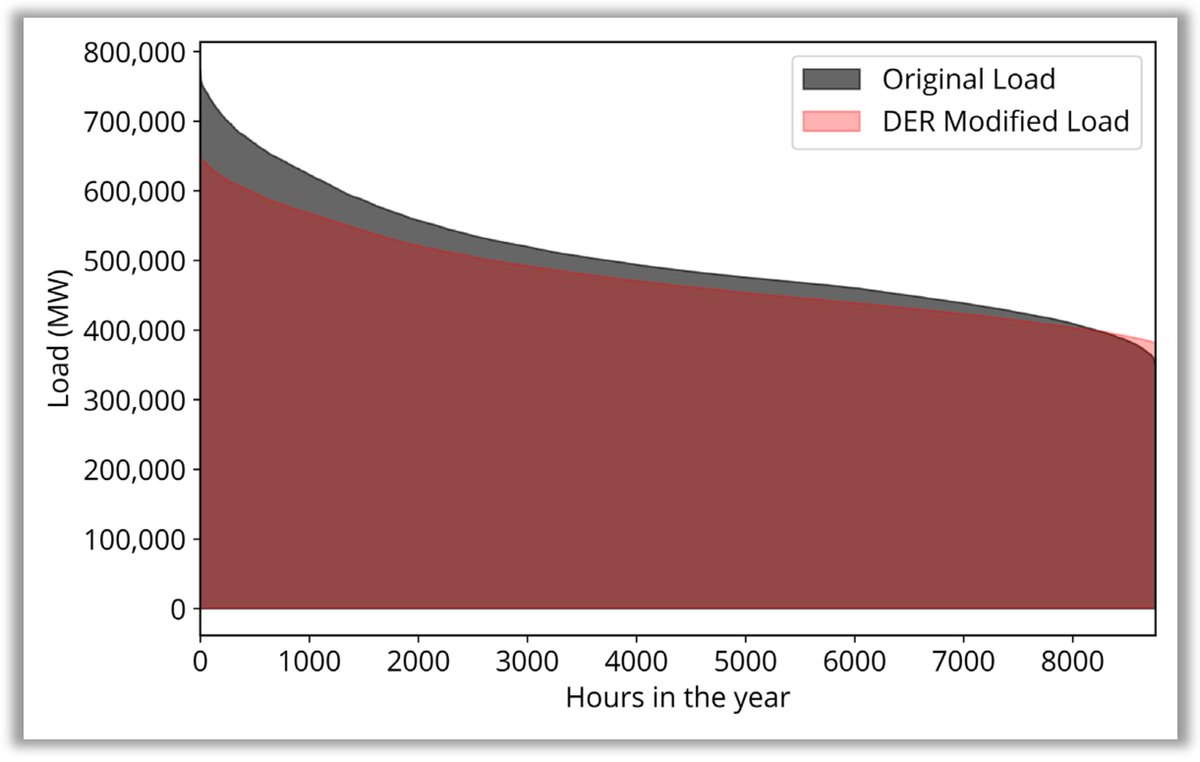
The co-optimization changes how demand is satisfied in new ways and this leads to cost reductions and more access to utility-scale VREs. The main change is that demand becomes much more flexible and shifts towards supply. This reduces the burden on all parts of the system.


The modeling never fails to meet any load at any 5-minute interval across any of the nodes in the US. We created a metric (system strain) to analyze the behavior. The scenarios have different ways of dealing with difficult conditions.

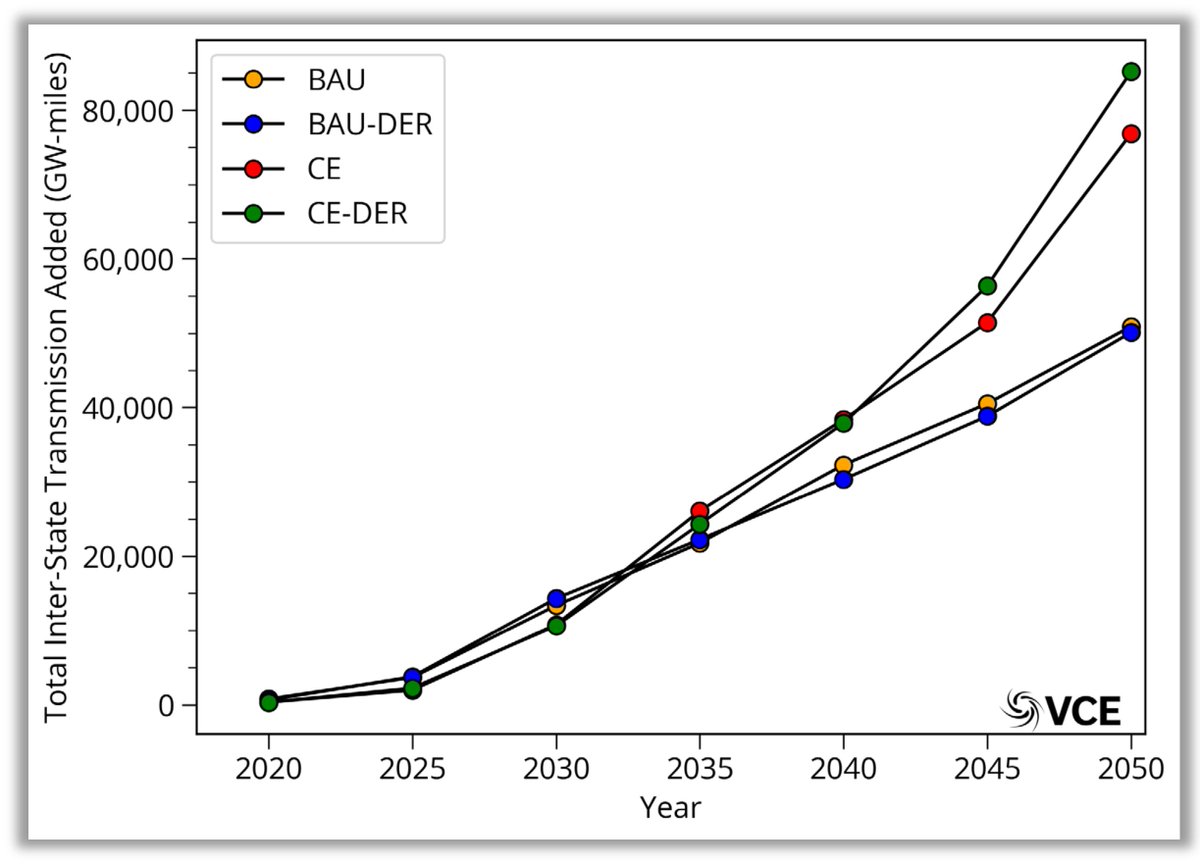
The distribution co-optimization actually relies on transmission more than without the co-optimization. It is because the model can determine the benefits and costs as well as the trade-offs. There is no single Goldilocks technology that will fix the entire system!
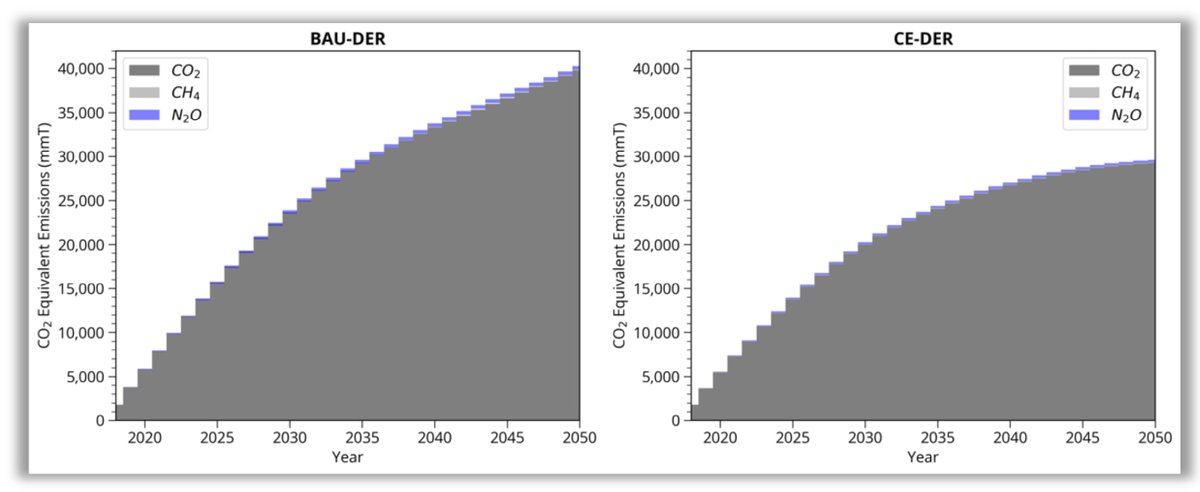
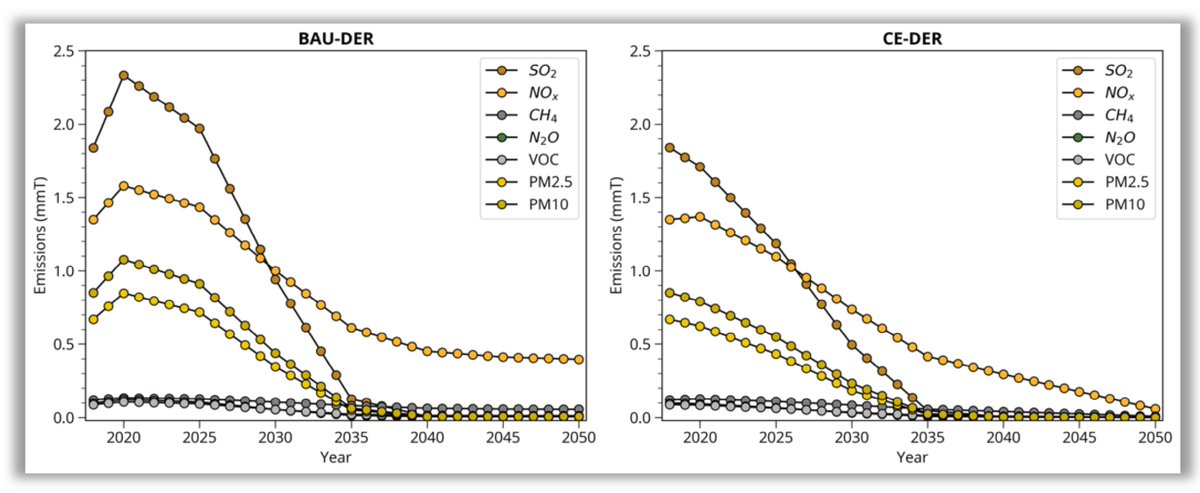
Cumulative emissions are computed by WIS:dom and with the Clean Electricity emissions halt by 2050 avoiding 10 Gt of CO2e emissions by that timeframe. Other pollutants are reduced dramatically earlier. This is good news for health, but we do not model those benefits.
As always, we use chronological modeling with detailed weather data for all components of the electricity system. This enables the model to detect patterns, benefits and costs for every time step and location. It can then piece them together like a concert.
Conclusion: Adding co-optimization of distribution infrastructure allows models to detect new pathways for decarbonization and lower-cost electricity that were obscured before. More analysis will follow this first report for #electrification, #climatechange and #RTO expansion
We will be releasing our ZeroByFifty report the second week of January (before the new administration is sworn in) that looks specifically at a zero carbon economy by 2050 and the benefits of each component. zero2050usa.com
@threadreaderapp please unroll
• • •
Missing some Tweet in this thread? You can try to
force a refresh