#Bitcoin is in a supply and liquidity crisis.
This is extremely bullish! And highly underrated.
I believe we will see this significantly reflected in Bitcoin's price in the upcoming months.
Let's take a look at the data.
A thread 👇👇👇
This is extremely bullish! And highly underrated.
I believe we will see this significantly reflected in Bitcoin's price in the upcoming months.
Let's take a look at the data.
A thread 👇👇👇

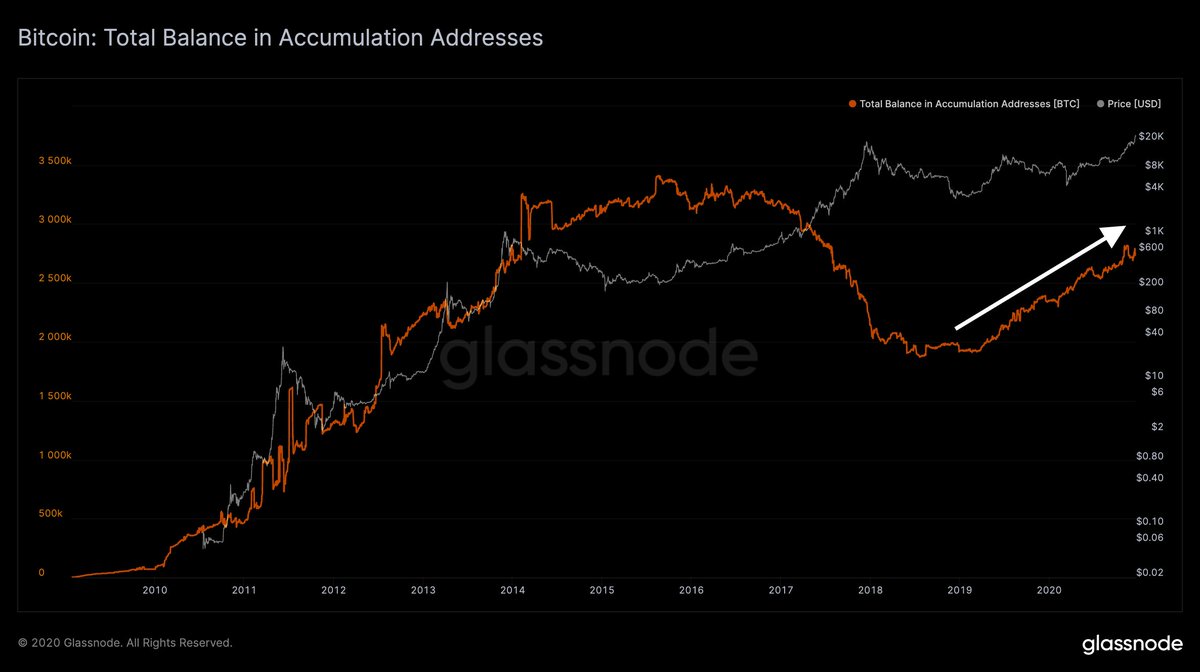
1/ Accumulation Balance
The amount of bitcoins held in accumulation addresses is 2.7M BTC.
Those are addresses that have only received bitcoins, and never spent funds.
True HODLers, hoarding 14.5 % of the circulating supply.
#Bitcoin
Chart: studio.glassnode.com/metrics?a=BTC&…
The amount of bitcoins held in accumulation addresses is 2.7M BTC.
Those are addresses that have only received bitcoins, and never spent funds.
True HODLers, hoarding 14.5 % of the circulating supply.
#Bitcoin
Chart: studio.glassnode.com/metrics?a=BTC&…
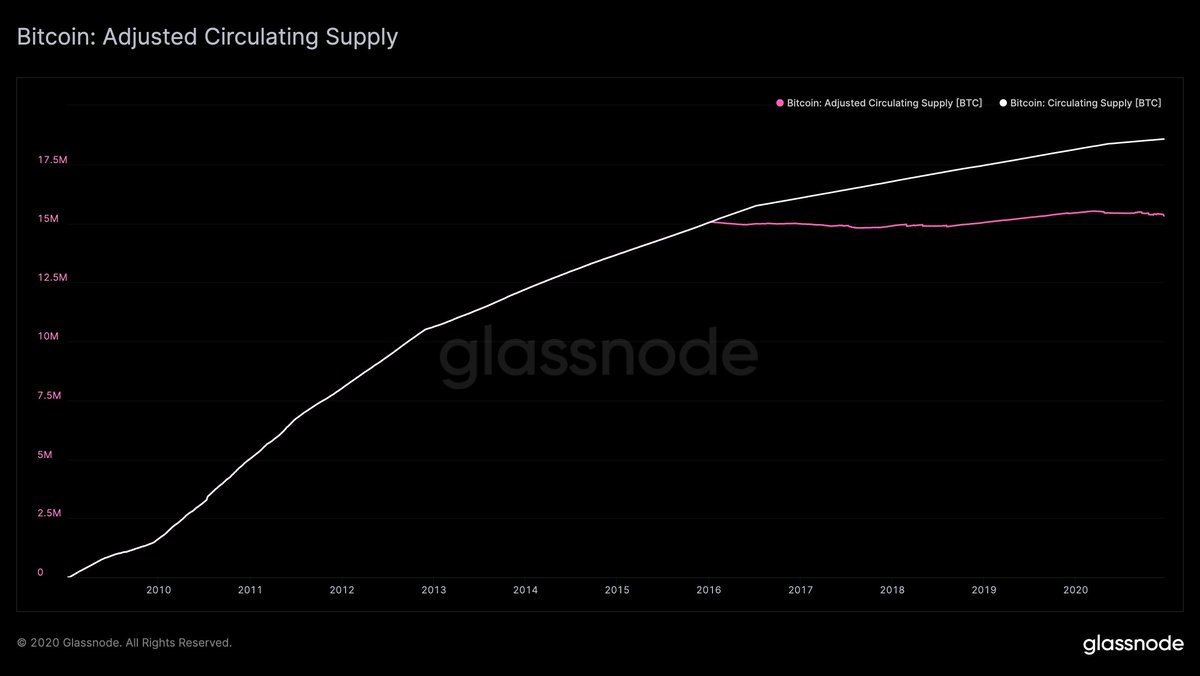
2/ Lost Coins
21 milltion bitcoins? You wish.
That's just the hard cap – considering lost coins, the real number is much less.
No one knows for sure how many, but estimations point to at least 3M.
That's 16% less circulating BTC available.
#Bitcoin
studio.glassnode.com/compare?a=BTC&…
21 milltion bitcoins? You wish.
That's just the hard cap – considering lost coins, the real number is much less.
No one knows for sure how many, but estimations point to at least 3M.
That's 16% less circulating BTC available.
#Bitcoin
studio.glassnode.com/compare?a=BTC&…
3/ Institutional #BTC Demand
@Grayscale (573M BTC), @MicroStrategy ($475M), @sqcrypto ($50M), Ruffer ($745M), @massmutual ($100M) – all buying up supply.
Do you really think they're alone? Of course not.
Expect many more on the move. They're coming – gradually, then suddenly.
@Grayscale (573M BTC), @MicroStrategy ($475M), @sqcrypto ($50M), Ruffer ($745M), @massmutual ($100M) – all buying up supply.
Do you really think they're alone? Of course not.
Expect many more on the move. They're coming – gradually, then suddenly.
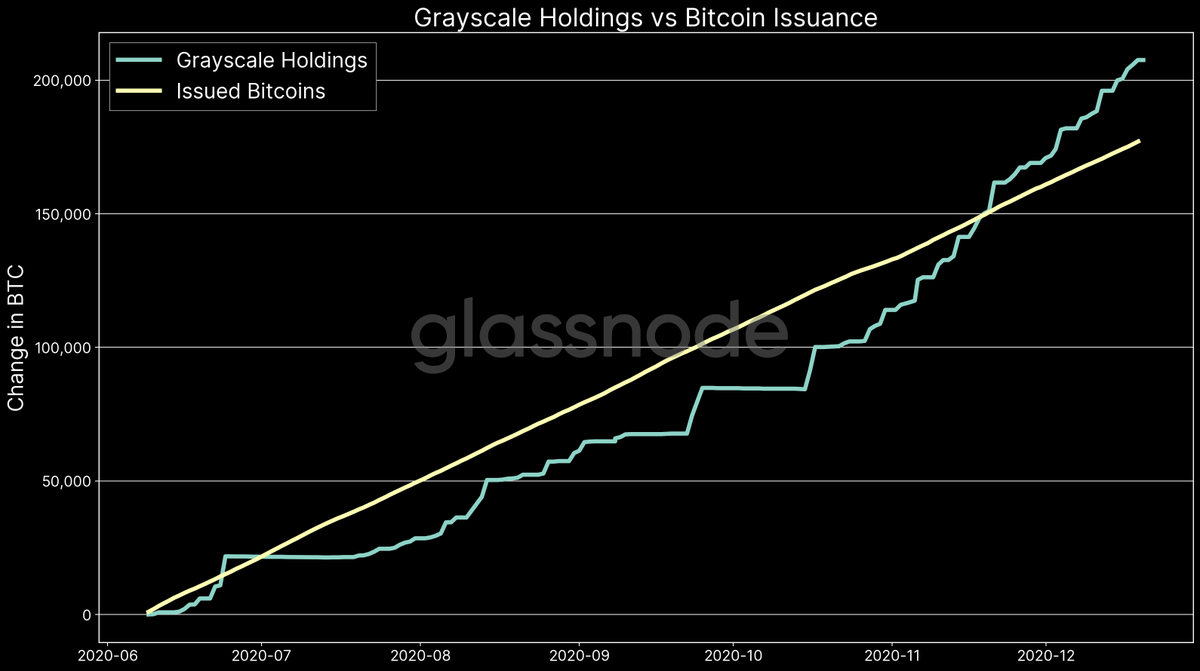
4/ Speaking of @Grayscale:
Bitcoins added to the Grayscale Bitcoin Trust in the past 6 months: ~210,000 BTC
Bitcoins mined in the past 6 months: ~185.000 BTC
That's right, Grayscale has been buying up more bitcoins than the amount issued.
Talk about a supply crisis!
#Bitcoin
Bitcoins added to the Grayscale Bitcoin Trust in the past 6 months: ~210,000 BTC
Bitcoins mined in the past 6 months: ~185.000 BTC
That's right, Grayscale has been buying up more bitcoins than the amount issued.
Talk about a supply crisis!
#Bitcoin
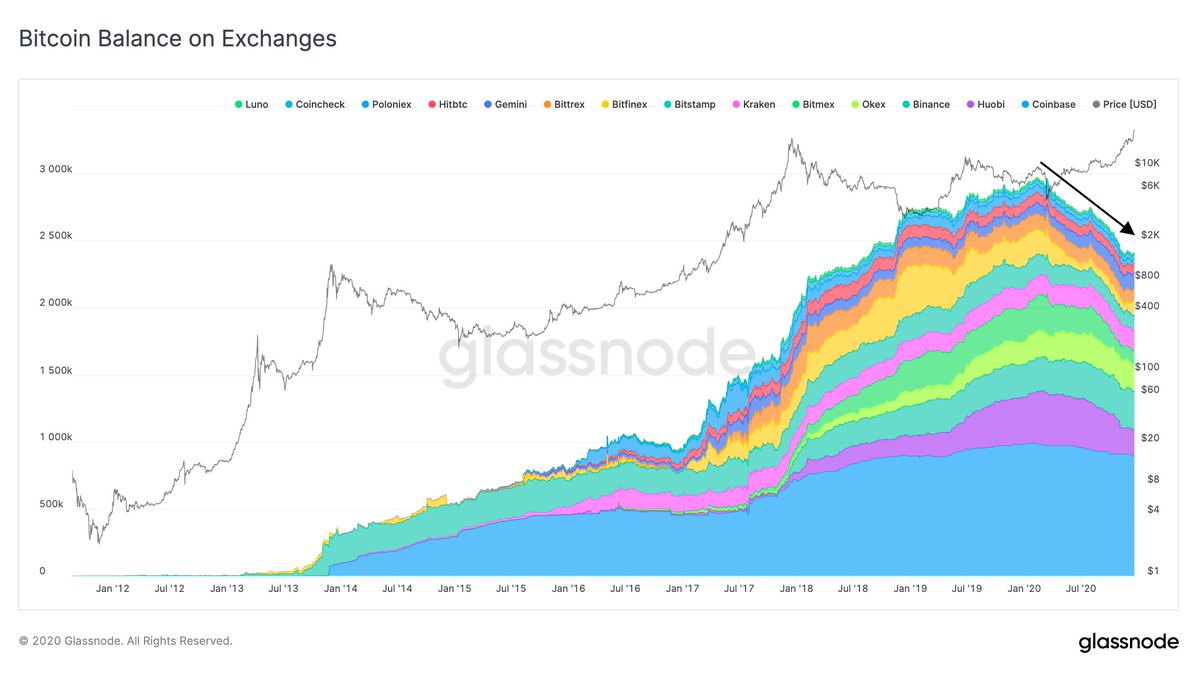
5/ Exchange Balances
Liquidity is vanishing from exchanges.
We're seeing the longest depletion of exchange funds.
Since January, the BTC supply on exchanges dropped a staggering 20%.
#BTC is being pulled to long-term storage, custodian wallets, etc.
studio.glassnode.com/metrics?a=BTC&…
Liquidity is vanishing from exchanges.
We're seeing the longest depletion of exchange funds.
Since January, the BTC supply on exchanges dropped a staggering 20%.
#BTC is being pulled to long-term storage, custodian wallets, etc.
studio.glassnode.com/metrics?a=BTC&…
6/ Liquid #Bitcoin Supply
14.4M BTC is held by illiquid entities – that is 78% (!) of the current supply.
Illiquid entities spend less than 25% of the BTC they receive, acting as supply sinks in the network.
Yes, only 12% of the BTC supply is liquid, according to this metric.
14.4M BTC is held by illiquid entities – that is 78% (!) of the current supply.
Illiquid entities spend less than 25% of the BTC they receive, acting as supply sinks in the network.
Yes, only 12% of the BTC supply is liquid, according to this metric.

7/ #Bitcoin Miner Supply
Are miners cashing out at these prices? I don't think so.
The amount of miner unspent supply (BTC that has never left the miner address) has been increasing since the last halving.
Current miner balance: 1.7M $BTC
Chart: studio.glassnode.com/metrics?a=BTC&…
Are miners cashing out at these prices? I don't think so.
The amount of miner unspent supply (BTC that has never left the miner address) has been increasing since the last halving.
Current miner balance: 1.7M $BTC
Chart: studio.glassnode.com/metrics?a=BTC&…

• • •
Missing some Tweet in this thread? You can try to
force a refresh