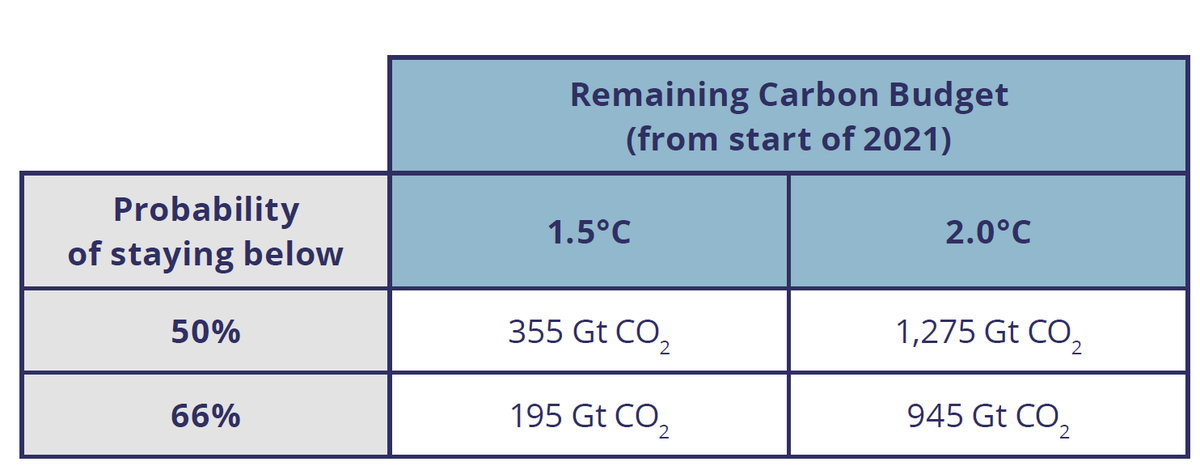
Some updated carbon budgets from @CONSTRAIN_EU
→ 5 years left for 66% <1.5°C (HT @rtmcswee)

To what degree should we look at 66% <1.5°C?
* According to the 2018 #SR15, there are no scenarios 66% <1.5°C
* Huge gap between 50% 1.5°C & 66% 2°C (~1.7-1.8°C)

constrain-eu.org/publications/z…
We have become so obsessed with these arbitrary lines at 1.5°C & 2°C, but I think the more relevant point, is that there is a HUGE gap between 1.5°C & 2°C.

While 1.5°C might be too late, there is still lots to fight for.

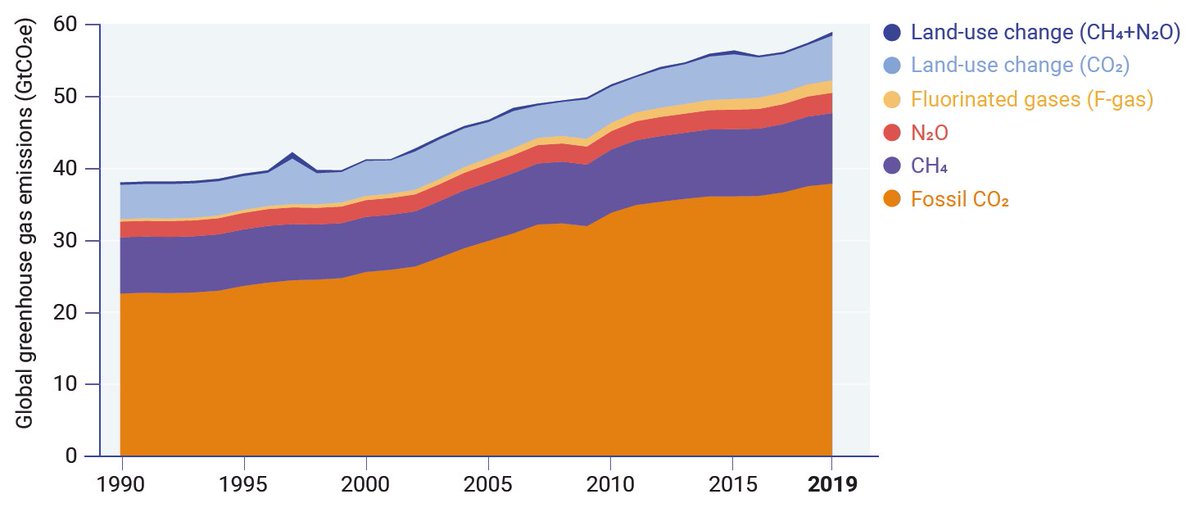
Every 0.1°C is ~200GtCO₂!

cicero.oslo.no/no/posts/klima…
A slight technical point. 66% <1.5°C is probably around 1.3-1.4°C for 50%. We are at ~1.2°C today, so a 0.1°C increase or 200GtCO₂ is quite consistent with the remaining budget for 66% <1.5%...

[The 0.1°C ~ 200GtCO₂ is based on the TCRE, see link in previous tweet]
In case you are not sick of me repeating this, I do not find this 66% framing all that useful. Better to talk about carbon budget ranges, like we do for the climate sensitivity & all other climate variables.

Paper: rdcu.be/bHT2C
Blog: cicero.oslo.no/no/posts/klima…

• • •

Missing some Tweet in this thread? You can try to force a refresh
 

Keep Current with Glen Peters

Glen Peters Profile picture

Stay in touch and get notified when new unrolls are available from this author!

Read all threads

This Thread may be Removed Anytime!

PDF

Twitter may remove this content at anytime! Save it as PDF for later use!

Try unrolling a thread yourself!

how to unroll video
  1. Follow @ThreadReaderApp to mention us!

  2. From a Twitter thread mention us with a keyword "unroll"
@threadreaderapp unroll

Practice here first or read more on our help page!

More from @Peters_Glen

23 Dec
1. Oil & gas companies still expect the world to consume large quantities of oil & gas in 2050. That view would seem to put the oil giants in conflict with the IPCC.

𝐈𝐧 𝐟𝐚𝐜𝐭, 𝐭𝐡𝐞 𝐨𝐩𝐩𝐨𝐬𝐢𝐭𝐞 𝐢𝐬 𝐨𝐟𝐭𝐞𝐧 𝐭𝐫𝐮𝐞...

@bstorrow eenews.net/climatewire/st…
2. [O]il companies & the IPCC alike rely on a contentious strategy known as negative emissions — the practice of pulling carbon dioxide out of the atmosphere. In theory, NETs would buy the world a little more time to phase out the use of fossil fuels ...
3. "[N]one of these models are forecast machines" @DetlefvanVuuren

"It's just an element, a tool to explore different trajectories on the basis of the knowledge we have today & to see what ... might encounter."

Both critics & modelers agree such nuance is often lost
Read 20 tweets
22 Dec
1. Integrated Assessment Models (IAMs) often assume the same carbon prices in each region (left, orange dots): this is efficient but leads to large inequities (right).

More equitable distributions of carbon prices (left, blue dots) is less efficient.

doi.org/10.1038/s41586…
2. @NB_pik addresses this problem in a new paper: "The core finding of this research is the strongly nonlinear trade-off between cost-efficiency and sovereignty in achieving the long-term PA climate target in an equitable way."

Small changes to efficiency have big equity gains.
3. The gaps between uniform & differentiated carbon prices (first tweet) was modified to create the trade-off curve (previous tweet). This was done by applying an exponential function to adjust pairs of regional prices.

Is the "core finding" dependent on the "exponential"?
Read 10 tweets
21 Dec
Given all the 𝗳𝗶𝗿𝗲𝘀 around the world, some might be surprised that the CO₂ emissions from land-use change in 2019 & 2020 are not too anomalous.

Why? Only the fires in the Amazon & SE Asia were from land-use change.

1/
globalcarbonproject.org/carbonbudget/i… Image
The big fires in Australia, Arctic, & California were 'natural' & not a consequence of land-use *change*.

Those fires result in either higher atmospheric concentrations or a weaker land sink (bottom left) & not bigger land-use change (top left).

Bottom right is net land.

2/ Image
We can measure the increase in the atmospheric concentration quite accurately, it is a matter or partitioning the CO₂.

Fires either go into land-use or land-sink, depending on cause. This is more an accounting (definition) convention.

All very complex...

3/ Image
Read 4 tweets
11 Dec
1. What happened to EU27 emissions in 2020 & what does it mean for the 55% 2030 target?

COVID19 sent CO₂ emissions down ~12%:
* Coal went down 18% in 2019, COVID cements this in
* Oil has grown last 5 years, 2020 needs to start a new decline
* Gas is stubborn, problem for 2030!
2. The EU target is for GHGs (not just CO₂), but now includes the forest sink.

The inclusion of the sink makes the relative reduction in emissions from 1990 larger (24% to 2018) & makes a 2030 target easier to achieve (in terms of reduced growth rates to achieve it).

But...
3. The inclusion of the land sink is probably necessarily to meet the 2050 net-zero GHG emission goal.

It may be hard to maintain the land sink, particularly in the face of climate change.

The alternative is using technical carbon removal (BECCS or DACCS, which have troubles).
Read 5 tweets
11 Dec
THREAD: Global Carbon Budget 2020

An unprecedented 2.4 GtCO₂ (7%) drop in emissions in 2020 due to COVID19 restrictions. But, daily emissions are already edging up towards levels last seen in late 2019.

#CarbonBudget globalcarbonproject.org/carbonbudget/i…
2. A drop of 2.4 GtCO₂ has not been seen before, but emissions have not been this high either.

After the global financial crisis emissions increased 1.7GtCO₂ in 2010. Will this record increase be surpassed in 2021?

Relative changes of >±7% were common before 1950...
3. Despite the rapid change in emissions, atmospheric CO₂ concentrations continued up as if COVID19 never happened.

Why?
* Emissions were high, as high as in 2012
* The relative change is smaller than interannual variability
* CO₂ is cumulative, so total emissions matter
Read 15 tweets
9 Dec
THREAD: UNEP #EmissionsGap Report 2020

Although the COVID-19 pandemic will cause a dip in 2020 emissions, this will not bring the world closer to the Paris Agreement goal of limiting global warming this century to well below 2°C & pursuing 1.5°C.

1/

unenvironment.org/emissions-gap-…
2. In 2019, total GHG emissions, including land-use change, reached a new high of 59.1 GtCO₂-eq.

Growth was 1.3% when excluding land-use change, but 2.6% when including land-use change due to large fires in 2019.
3. The top seven emitters (including international transport) have contributed to 65% of GHG emissions, with G20 members accounting for 78%.

The top emitters can have very different emissions per person (right)
Read 14 tweets

Did Thread Reader help you today?

Support us! We are indie developers!


This site is made by just two indie developers on a laptop doing marketing, support and development! Read more about the story.

Become a Premium Member ($3/month or $30/year) and get exclusive features!

Become Premium

Too expensive? Make a small donation by buying us coffee ($5) or help with server cost ($10)

Donate via Paypal Become our Patreon

Thank you for your support!

Follow Us on Twitter!