There are good reasons to be much more concerned about the new wave 3, than about wave 2 - a quick thread.
Here's the relationship between the number of cases in England among those aged 60+ and the number of people hospitalised by Covid - the one follows the other with a lag.
...And here is the relationship between Covid hospitalisations and deaths - again, the one follows the other with a lag
So todays cases are tomorrow's deaths, and the current rise in cases means more deaths in a couple of weeks. But there are further reasons to be concerned.
First, unlike waves 1 & 2, we start with lots of Covid patients already in our hospitals, and it's winter, so spare capacity is much lower.

Numbers hospitalised in England are set to shooting up past the original peak & likely to keep climbing, because cases are still going up.
Second, the increase in places with the new variant is SO much steeper than before.

2 months ago there were less than ten Covid patients in Kent hospitals. Now there's twice as many as in the spring peak. If that happened elsewhere it would overwhelm services in lots of places
Third, until recently the scary rate growth of cases in London was at least confined to younger people. But now it has, inevitably, spread to older people. As rates spike among older people, and hospital admissions are starting to rise faster.
So to sum up:
- Today's cases = tomorrows deaths, and they're rising
- We are starting winter wave with far less headroom
- Places with the new variant see very rapid increases
- Once it spreads among younger people it will inevitably get to older people
> Need to hit it hard now

• • •

Missing some Tweet in this thread? You can try to force a refresh
 

Keep Current with Neil O'Brien MP

Neil O'Brien MP Profile picture

Stay in touch and get notified when new unrolls are available from this author!

Read all threads

This Thread may be Removed Anytime!

PDF

Twitter may remove this content at anytime! Save it as PDF for later use!

Try unrolling a thread yourself!

how to unroll video
  1. Follow @ThreadReaderApp to mention us!

  2. From a Twitter thread mention us with a keyword "unroll"
@threadreaderapp unroll

Practice here first or read more on our help page!

More from @NeilDotObrien

21 Dec
My piece below looks at Sweden. Recent days have seen Sweden’s Nordic neighbours Finland and Norway offer emergency medical assistance as Stockholm’s hospitals overflow & the King make an unprecedented criticism of the failed strategy. What went wrong?

newstatesman.com/world/europe/2…
Sweden started with massive advantages: more people living alone than anywhere else and a sparse population. But it ended up with death rates 9 and 10 times that of neighbours Finland and Norway
Nor has there been an economic upside for Sweden: in fact they had a bigger hit to their economy than their neighbours, as well as much worse health outcomes.
Read 6 tweets
19 Dec
Cases rising fastest in new tier 4 areas but they are curving up in every region of England. Need to watch out. Image
Same data but just for the last week - though some much faster than others, every region is rising. Image
Number of coronavirus patients in hospitals (which is a lagging indicator) is going up fast in London, the south east and east of England. Image
Read 4 tweets
29 Nov
ONE BOGUS CLAIM IN THE TELEGRAPH AND WHY IT MATTERS – A thread
The Sunday Telegraph reports that “Boris Johnson's decision to impose tougher tiers of restrictions on much of the country this week will cost the economy £900 million a day, according to a leading economic forecaster.”

telegraph.co.uk/news/2020/11/2…
The forecaster in question is Doug McWIlliams at @Cebr_uk . The Sunday Telegraph reports that: “New analysis estimates the new tiers will result in England's GDP being 13pc smaller, or £900 million a day, compared with Dec last year”.
Read 29 tweets
23 Nov
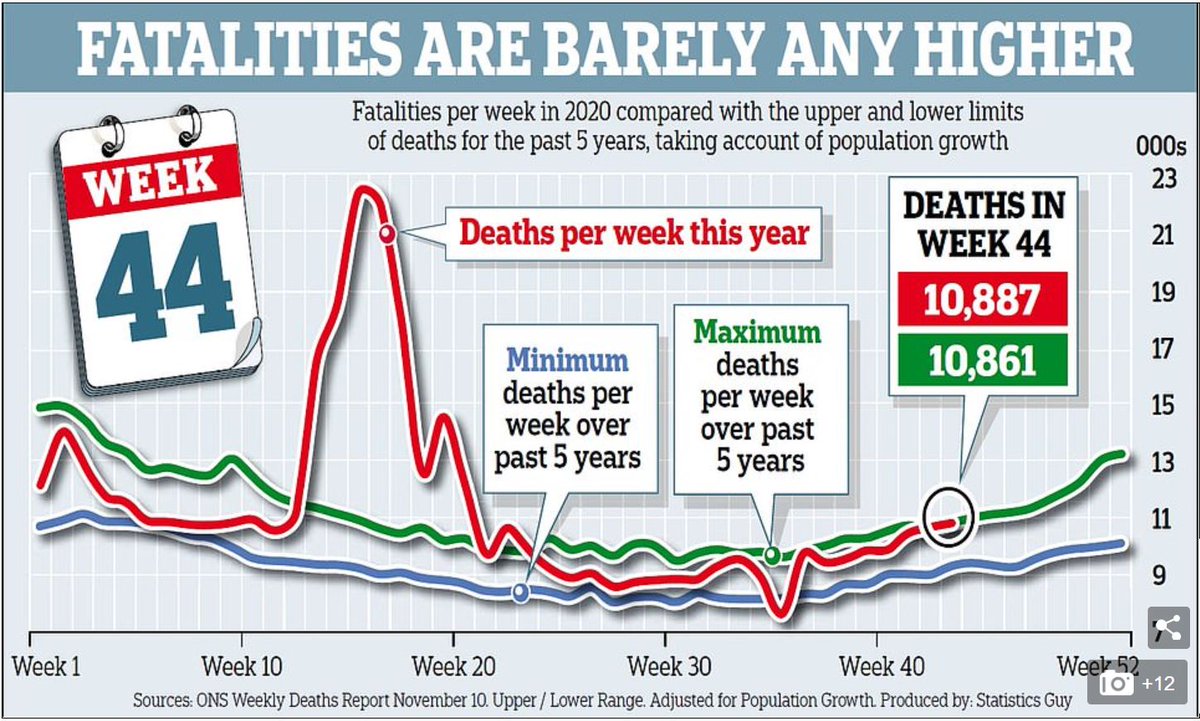
JUST ONE GRAPH IN THE DAILY MAIL - a thread.
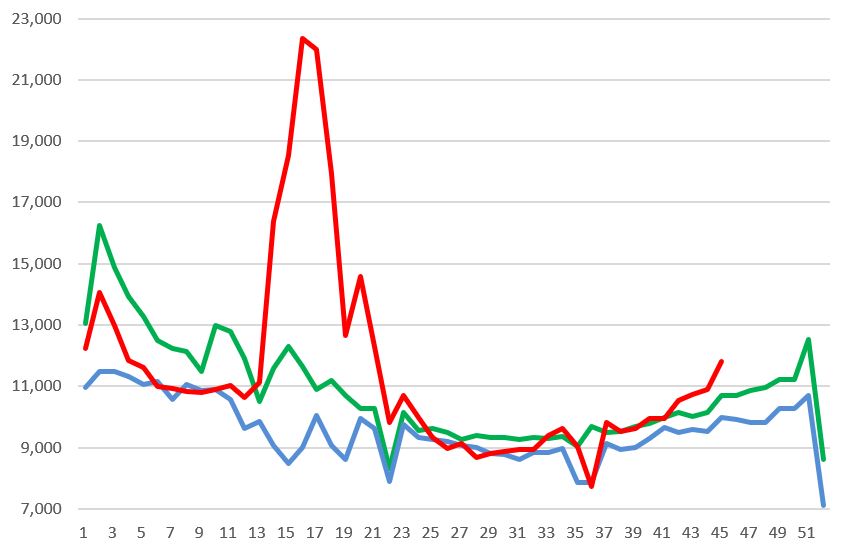
The Daily Mail published this chart. 2 things about it struck me. First, I’d seen the same data from the ONS, which sadly showed excess deaths in recent weeks – in fact higher than any time in the last 5 years. But this chart purported to show just the opposite. First, the Mail:
And now the ONS data. It is back above the highest levels we have seen in recent years. Given it is a lagging indicator, it may keep rising for a bit yet.
Read 14 tweets
16 Oct
TAKING THE GREAT BARRINGTON DECLARARTION SERIOUSLY – a thread.
1 or 2 MPs have advocated the ideas in the “Great Barrington Declaration”: that we should get back to normal, go for herd immunity, & try to shield the elderly & vulnerable. Rather than dismiss this out of hand I've tried to crunch some numbers on what it would mean in practice.
First, how many people would need to totally isolate as the virus accelerates through the rest of the population?
Read 25 tweets
7 Sep
Quick thread on our "levelling up" report today & new Taskforce.

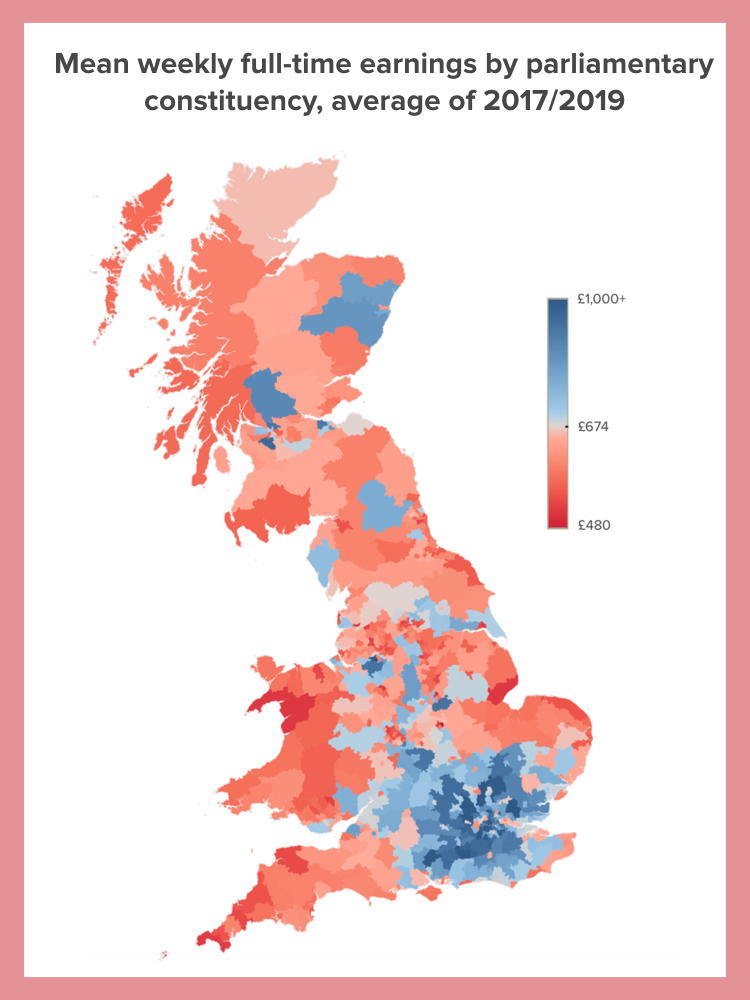
Most people know there's a big gap in earnings and incomes between London, the SE & Scotland on the one hand and the rest of the country on the other (map below). But lots turns on how you measure things... (1/15)
My report looks at how subtly different ways of measuring performance can tell VERY different stories about what's happening in different places. (2/15)
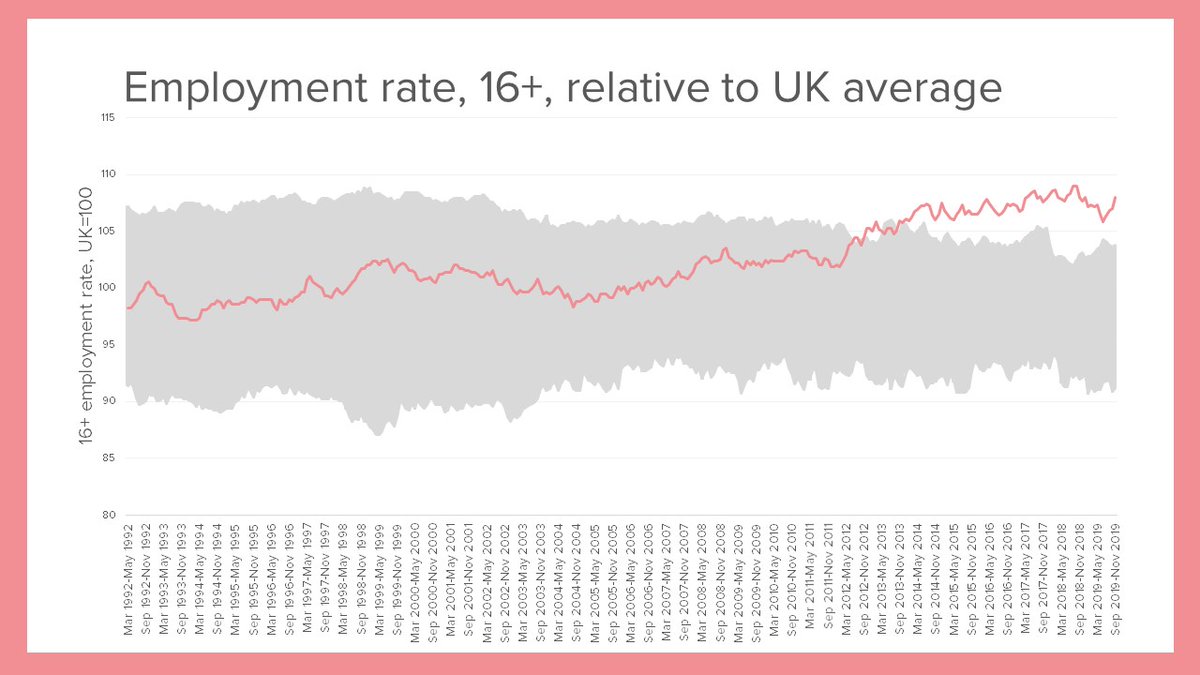
For example, if you look at the employment rate for 16-64 year olds, London is in the middle of the pack.

But look at 16+ employment, and London (in red) is zooming ahead - pension age employment is much higher there. (3/15)
Read 15 tweets

Did Thread Reader help you today?

Support us! We are indie developers!


This site is made by just two indie developers on a laptop doing marketing, support and development! Read more about the story.

Become a Premium Member ($3/month or $30/year) and get exclusive features!

Become Premium

Too expensive? Make a small donation by buying us coffee ($5) or help with server cost ($10)

Donate via Paypal Become our Patreon

Thank you for your support!

Follow Us on Twitter!