Canada and the US were the two most generous advanced countries when it came to direct aid (Germany's fiscal response looks bigger on paper, but the vast majority of it was just in the form of loan guarantees or other non-direct aid). /1
Canada gave the equivalent of USD $1,560 per month to its jobless workers through the CERB program, *in lieu of* their version of UI (which they call EI). This went until October. Since in theory you weren't supposed to get both EI & CERB, CERB shouldn't have counted as EI weeks.
The US by contrast gave USD $2,600 per month to all UI recipients, *on top of* their UI benefits, through July 31. That includes gig economy PUA beneficiaries who got around $200 per week base benefits in their program; Canada's CERB was meant to address gig workers too.
The US jobless then got another USD $1,300 per month for up to 6 weeks from Aug 1 through mid-September through the LWA program; in reality this largely came out as lump-sum catch-up payments.
But of course, to get these payments in the US you had to be in the UI system, which meant you were using up weeks of eligibility. The CARES Act added another 13 weeks of UI benefits and set the PUA lifespan to 39 weeks...
...but without this new bipartisan bill, PUA and the extra 13 weeks in PEUC expires tomorrow.

So without the bipartisan deal, the US will have been much more generous through mid-September, but Canadian CERB + EI will have lasted longer.
With the bipartisan deal & another 11 weeks of PUA & PEUC (14 weeks if you're already enrolled at the end), plus another USD $1,300/month top-up, the US will fairly decisively have been more generous to the jobless on average since Mar, tho w/ much more real-time uncertainty
To sum up, if you were jobless you got, all in:

Canada (under CERB):
USD $1,560 per month, through end-September

US (regular UI + FPUC):
Typically USD $3,900 per month, through end-July

US (PUA + FPUC)
Typically USD $3,467 per month, through end-July
US (regular UI + LWA)
Typically USD $2,600 per month, Aug 1 - mid-Sep

US (regular UI only)
Typically USD $1,300 per month, mid-Sep - present

US (regular UI + FPUC, if bipartisan deal signed)
Typically USD $2,600 per month, end-Dec - mid-Mar/start-April

• • •

Missing some Tweet in this thread? You can try to force a refresh
 

Keep Current with Ernie Tedeschi

Ernie Tedeschi Profile picture

Stay in touch and get notified when new unrolls are available from this author!

Read all threads

This Thread may be Removed Anytime!

PDF

Twitter may remove this content at anytime! Save it as PDF for later use!

Try unrolling a thread yourself!

how to unroll video
  1. Follow @ThreadReaderApp to mention us!

  2. From a Twitter thread mention us with a keyword "unroll"
@threadreaderapp unroll

Practice here first or read more on our help page!

More from @ernietedeschi

21 Dec
Here's a pre-buttal on some takes we're sure to see on this new stimulus package:

1. Stimulus checks are only around 1/5 of the total bill.
2. UI in America typically pays around 50% of pre-layoff wages, though it varies. With this extra $300/week, that will be ~85%.

1/X
3. If you're unemployed, you get an extra $1,300 per month through mid-March. If you're a gig worker or been out of work since early 2020, that's on top of having your UI benefits extended.

2/X
4. The bill includes another ~$300 billion in PPP loans, which are essentially payroll support for small businesses. If a business wants them *fully* forgiven, they essentially have to maintain their employment and wages -- effectively the equivalent 100% payroll support.

3/X
Read 7 tweets
4 Dec
Jobs Day, November 2020
The good news is: payrolls grew. The bad news is: payrolls only grew +245K when we still have a ~10 mil jobs gap. At that pace it would take until the end of 2024 just to get back to where employment was in February.

We all hope & expect jobs will reaccelerate, but this is weak
And the gaps remain large. Leisure & hospitality employment remains more than 20% smaller than it was pre-COVID, even after recovering many of the initial jobs lost.

The overall gap is only now reaching its *greatest extent* during the Great Recession.
Read 5 tweets
3 Dec
As a reminder, my base models, which use Homebase, Kronos/UKG, & UI claims data, are pointing to a -515K to -228K seasonally-adjusted decline in nonfarm payrolls for November tomorrow (-198K to +93K non-seasonally-adjusted).

One more attempt at kicking the tires... /1
Homebase, in a report published this week, showed how their index performed last year. As you can see, there were declines between October and November last year as well.

In fact last year's Oct-Nov decline was -4%; this year it's -3%, a bit *better*. /2 joinhomebase.com/wp-content/upl…
Now let's pause here and notice too that there have been *several* months now where Homebase data outperformed in 2020 month-to-month versus 2019. And yet the base models have performed well. /3
Read 6 tweets
2 Dec
Ahead of the ADP release at 8:15am, a brief thread on what high-frequency private data is suggesting we'll get for November payrolls, why it might be right, and why it might be wrong. /1
Note that I've augmented my high-frequency payrolls model to more explicitly address autocorrelation. /2
Data from Homebase, Kronos/UKG, and UI claims is consistent with November payroll employment growing at -515K to -228K seasonally-adjusted (-198K to +93K non-seasonally-adjusted). /3
Read 11 tweets
25 Nov
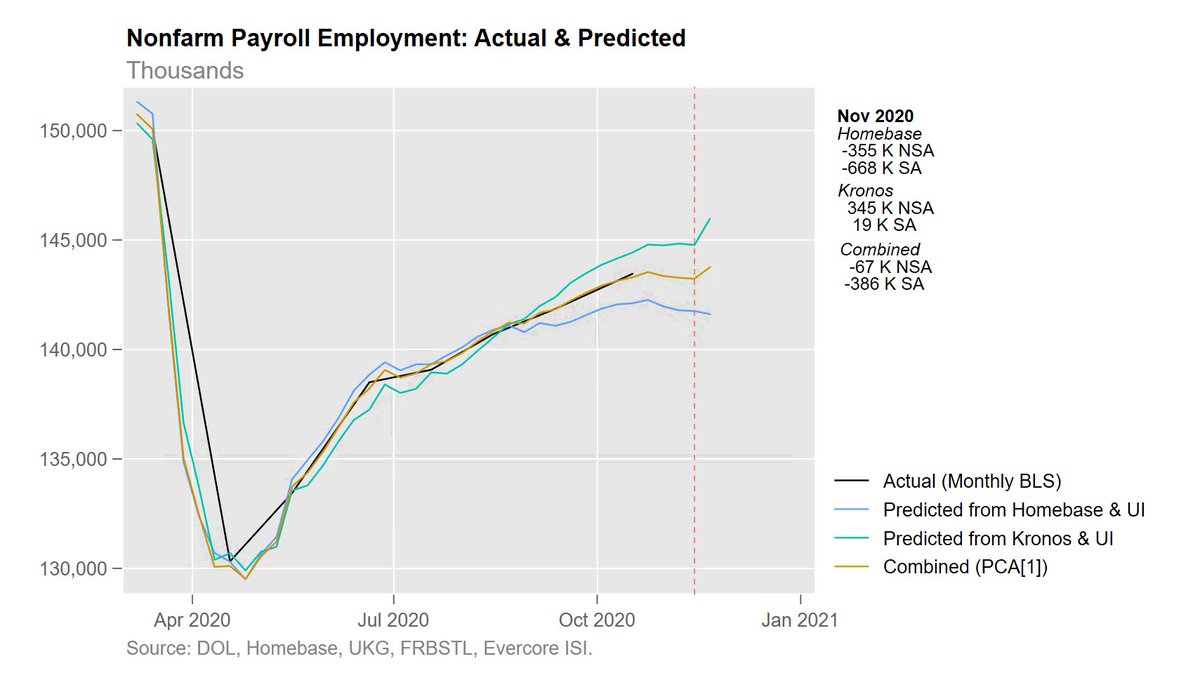
The latest UI claims, Homebase, & Kronos numbers are consistent with payrolls coming in at -67K not-seasonally-adjusted for November, and -386K seasonally-adjusted. Image
There was a "pop" in the latest week of the Kronos data, but 1) it was the week after the reference week, and 2) because Kronos allows its sample to change over time, it may reflect new customers rather than employment changes at existing ones.
The St. Louis Fed uses Kronos microdata to calculate a "chained" version that keeps sample composition constant, but they don't have the latest week yet. Will be interesting to see if that rise is robust.
Read 5 tweets
23 Nov
🚨🚨🚨
A slew of recent data is consistent with slow or even negative jobs growth in November. A quick thread.
November is typically a month when we expect raw, non-seasonally-adjusted employment data to *strengthen* (due, among other things, to hiring up for the holidays).

So when the unadjusted data is weakening or shrinking in November, that's an especially bad sign.
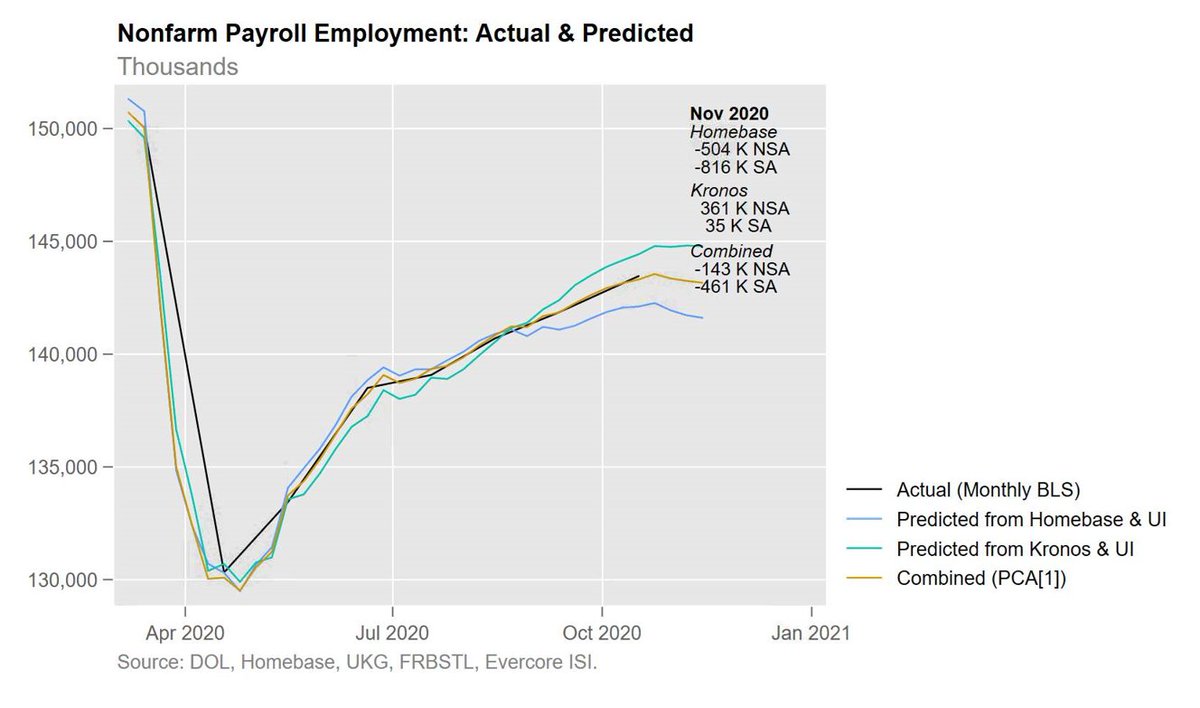
Data from Homebase, a private scheduling firm, suggest shrinking employment b/t mid-Oct and mid-Nov. Kronos, a different firm, shows slightly positive but weak growth.

Both, in tandem w/ UI claims, are consistent with -143K jobs in Nov not-seasonally-adjusted, or -461K adjusted.
Read 8 tweets

Did Thread Reader help you today?

Support us! We are indie developers!


This site is made by just two indie developers on a laptop doing marketing, support and development! Read more about the story.

Become a Premium Member ($3/month or $30/year) and get exclusive features!

Become Premium

Too expensive? Make a small donation by buying us coffee ($5) or help with server cost ($10)

Donate via Paypal Become our Patreon

Thank you for your support!

Follow Us on Twitter!