Most recent Test and Trace data for 17th - 23rd Dec.
Worrying fall in test performance, contact tracing remains v strong. Apologies for the fairly long NY thread 🧵
(still no T&T graphs this week)
gov.uk/government/pub…
Worrying fall in test performance, contact tracing remains v strong. Apologies for the fairly long NY thread 🧵
(still no T&T graphs this week)
gov.uk/government/pub…

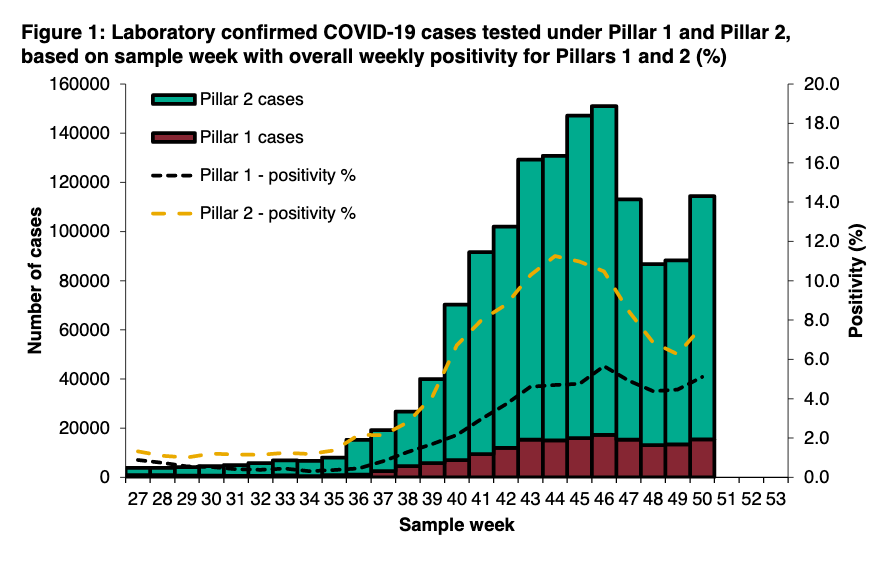
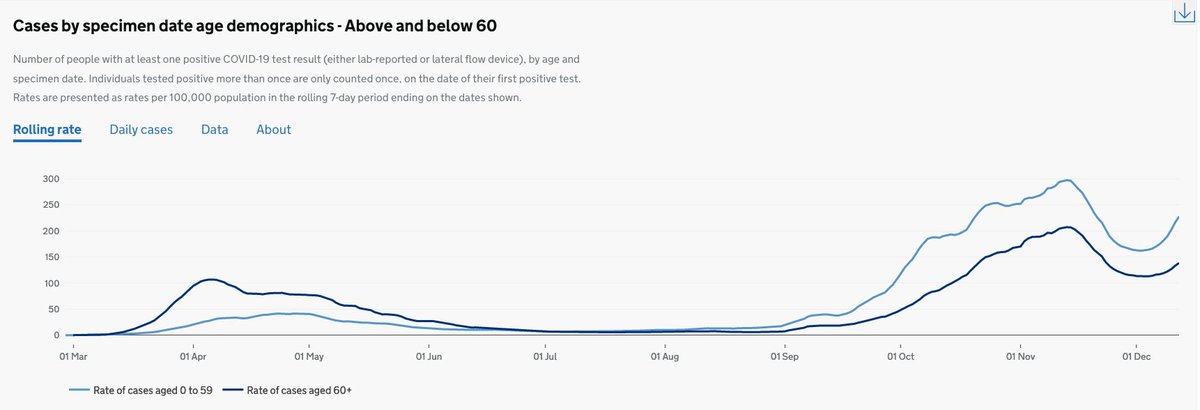
A huge 2.4m people were tested - up 20% on the week before. And 232k people tested positive, 33% more than last week and more than double two weeks before.
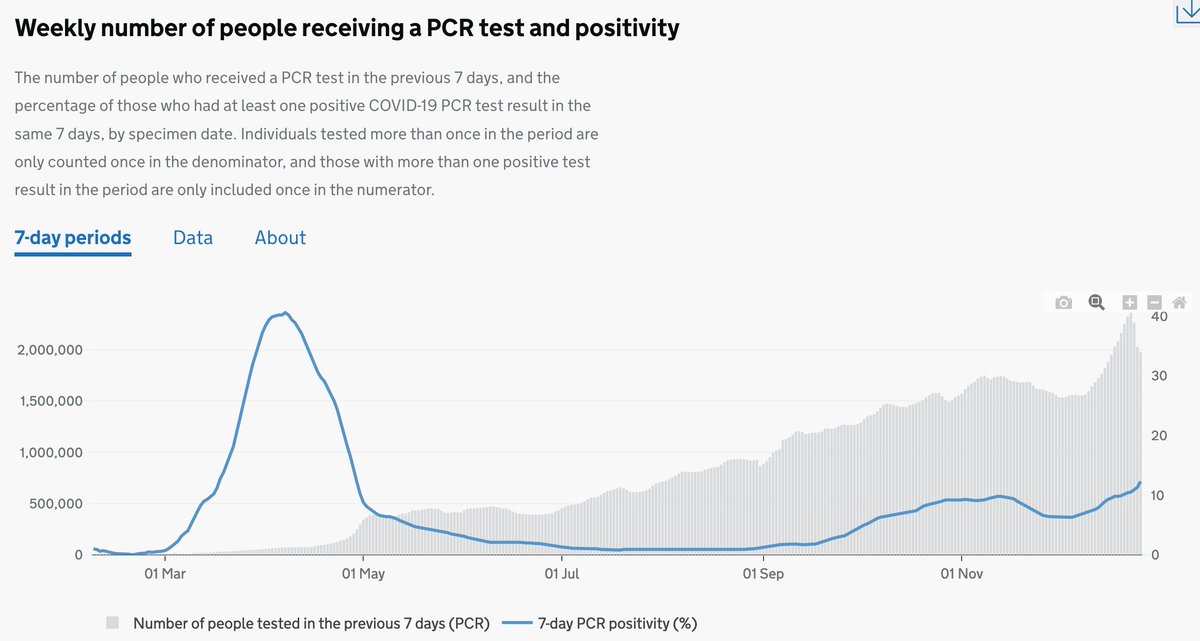
Positivity up to 9.7% from 8.8% wk before (7.9% in pillar 1, 10% in pillar 2).
Figure is from @PHE_uk, to 27th December
Positivity up to 9.7% from 8.8% wk before (7.9% in pillar 1, 10% in pillar 2).
Figure is from @PHE_uk, to 27th December

Increasingly hard to interpret P2 test positivity trends (community testing).
Includes the rapid lateral flow devices (LFDs) and PCR tests.
LFDs increasing and now make up 10% of P2 tests (242k) but their positivity is just 1.8% (0.4% 2wks before).
P2 PCR positivity is 10.3%
Includes the rapid lateral flow devices (LFDs) and PCR tests.
LFDs increasing and now make up 10% of P2 tests (242k) but their positivity is just 1.8% (0.4% 2wks before).
P2 PCR positivity is 10.3%


LFDs are used for asymptomatic cases, PCR for symptomatic (+ some asymptomatic).
LFD positivity will vary as prevalence differs among popn getting LFDs, which is changing wk by wk (used for outbreak mgmt, high risk settings, unis, schools...). Therefore, confusing for trends.
LFD positivity will vary as prevalence differs among popn getting LFDs, which is changing wk by wk (used for outbreak mgmt, high risk settings, unis, schools...). Therefore, confusing for trends.
As mentioned before, would be v helpful to see asymptomatic vs symptomatic testing more routinely reported.
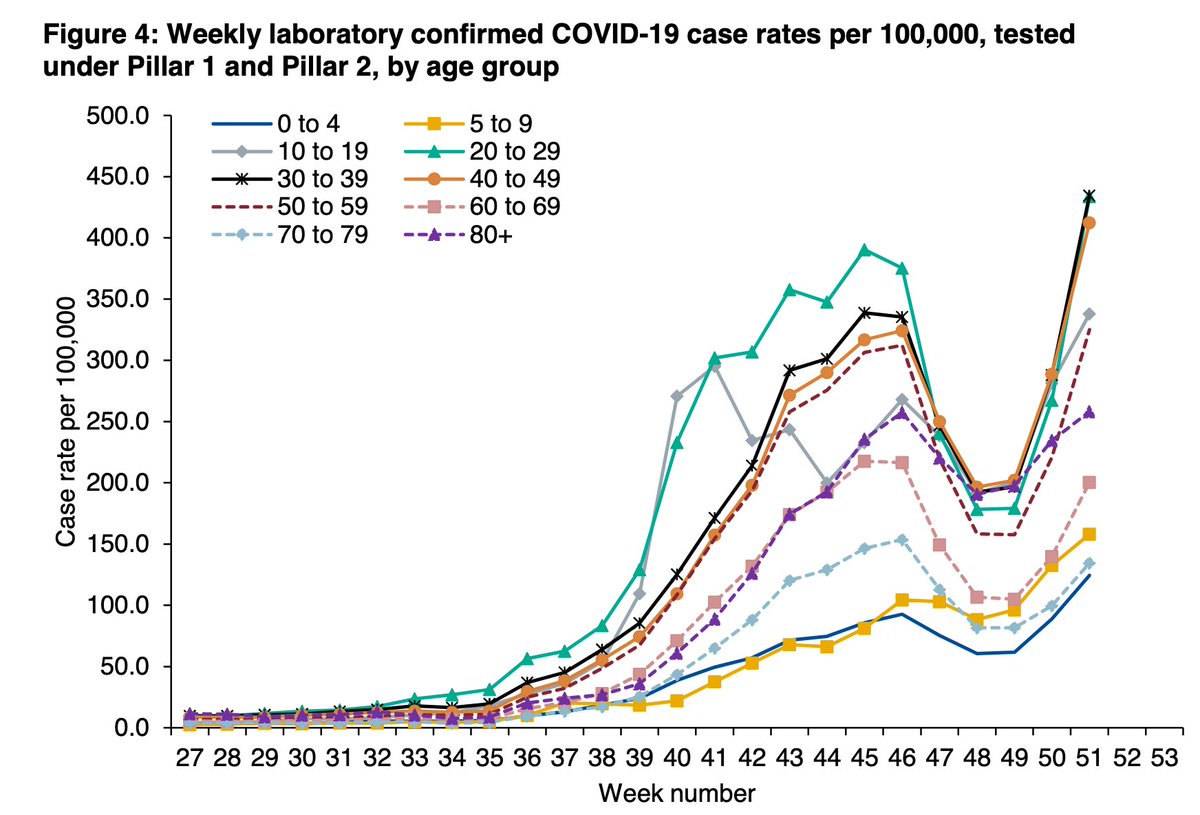
Graph from PHE useful to see why.
Graph from PHE useful to see why.

As number of people getting tested has increased, there have been v significant declines in community test performance, across all test routes (regional, local, and mobile test sites, satellite tests, and home tests).

Just 16.5% of regional test site results were received within 24hrs, compared to *65%* at start of Dec.
And 11.9% (38,289 tests) took >72hrs compared to 0.3% 3wks before (not to mention ⬆️ in ppl still awaiting results)
Median time to results has nearly doubled from 21 to 38hrs
And 11.9% (38,289 tests) took >72hrs compared to 0.3% 3wks before (not to mention ⬆️ in ppl still awaiting results)
Median time to results has nearly doubled from 21 to 38hrs


For local test sites it was just 12% within 24hrs compared to 52% at start of Dec, and 14% (59,385 tests) taking >72hrs up from 0.3%.
Mobile test sites similar decline - 24% within 24hrs down from 79% 3wks before, and 8% taking more than 72hrs.
Mobile test sites similar decline - 24% within 24hrs down from 79% 3wks before, and 8% taking more than 72hrs.


For satellite test sites and home tests, performances also worsening.
And avg distance people are having to travel is rising.
And avg distance people are having to travel is rising.


Performance for next day (rather than 24hr) results is a little better, but far from great.
As case numbers rise fast, increasing time to results is v worrying - more time to identify and reach contacts who haven't yet been asked to isolate, and more time for disease to spread.
As case numbers rise fast, increasing time to results is v worrying - more time to identify and reach contacts who haven't yet been asked to isolate, and more time for disease to spread.

Despite big rises in case numbers and contacts, contact tracing performance remains really strong.
212k cases were transferred to the system (most ever & more than 2x number two wks before), 86% - 182k - were reached & 79% provided details of contacts. Both similar to recent wks
212k cases were transferred to the system (most ever & more than 2x number two wks before), 86% - 182k - were reached & 79% provided details of contacts. Both similar to recent wks

The vast majority of cases (177k, >97%) were handled by the national T&T team (along with local authority contact tracing teams for cases not reached within 24hrs).
The remaining 4.6k more complex cases handled by PHE local health protection teams (HPTs)
The remaining 4.6k more complex cases handled by PHE local health protection teams (HPTs)
For cases managed by T&T, 80% were reached within 24hrs (up from 75% a couple of wks before, helpful for local systems as case number rise).
There were a record 408k contacts identified (more than double that of two wks ago), of which an impressive 93% were reached.

The increase in contacts is entirely from cases handled by T&T (with local gov systems).
For HPT cases, the number of cases per contact is now <1 (cf 2.3 per case handled by T&T)
For these HPT cases it's been <3 for a couple of months but was as high as 30 in early sept.
For HPT cases, the number of cases per contact is now <1 (cf 2.3 per case handled by T&T)
For these HPT cases it's been <3 for a couple of months but was as high as 30 in early sept.
Reason for fall in contacts per HPT case isn't clear.
Likely mix of changing HPT case load, social distancing, use of PPE, better infection control etc, but may also be case/contact reporting, or other factors?
@SMHopkins @FurberA @IsaacATFlorence can you shed any light here?
Likely mix of changing HPT case load, social distancing, use of PPE, better infection control etc, but may also be case/contact reporting, or other factors?
@SMHopkins @FurberA @IsaacATFlorence can you shed any light here?
A best ever 98% of contacts were reached by T&T within 24hrs of being identified, and 78.5% within 24hrs of the case being identified.


In summary, a really concerning wk on wk fall in test performance as case numbers rise.
The issue (on paper, at least) doesn't appear to be one of capacity, I just hope it's sorted asap.
On the flip side, at least contact tracing performance is as good as it's ever been.
The issue (on paper, at least) doesn't appear to be one of capacity, I just hope it's sorted asap.
On the flip side, at least contact tracing performance is as good as it's ever been.

And the current critical challenges facing hospitals (that are yet to see the consequences of social mixing over Christmas), mean that following guidance, and isolating when symptomatic, if testing positive, and if a contact, has never been more important. 🙏
Wk 30 T&T @felly500 @trishgreenhalgh @deb_cohen @martinmckee @carolecadwalla @mgtmccartney @ADPHUk
@Jeanelleuk @fascinatorfun @profchrisham @petermbenglish @HPIAndyCowper @Davewwest @HSJEditor @KateAlvanley
@IndependentSage @nedwards_1 @chrischirp @SamanthaJonesUK
@Jeanelleuk @fascinatorfun @profchrisham @petermbenglish @HPIAndyCowper @Davewwest @HSJEditor @KateAlvanley
@IndependentSage @nedwards_1 @chrischirp @SamanthaJonesUK
@ewanbirney @TimHarford @devisridhar @FurberA
@andrewleedr @kieran_walshe @DrChadborn @Dr_D_Robertson
@andrewleedr @kieran_walshe @DrChadborn @Dr_D_Robertson
• • •
Missing some Tweet in this thread? You can try to
force a refresh