PHE's weekly flu and COVID surveillance report now out.
Covering 15th-22nd December.
As PHE's Dr Yvonne Doyle says, this is not a normal Christmas. Please don't treat it like one.
gov.uk/government/sta…
Covering 15th-22nd December.
As PHE's Dr Yvonne Doyle says, this is not a normal Christmas. Please don't treat it like one.
gov.uk/government/sta…
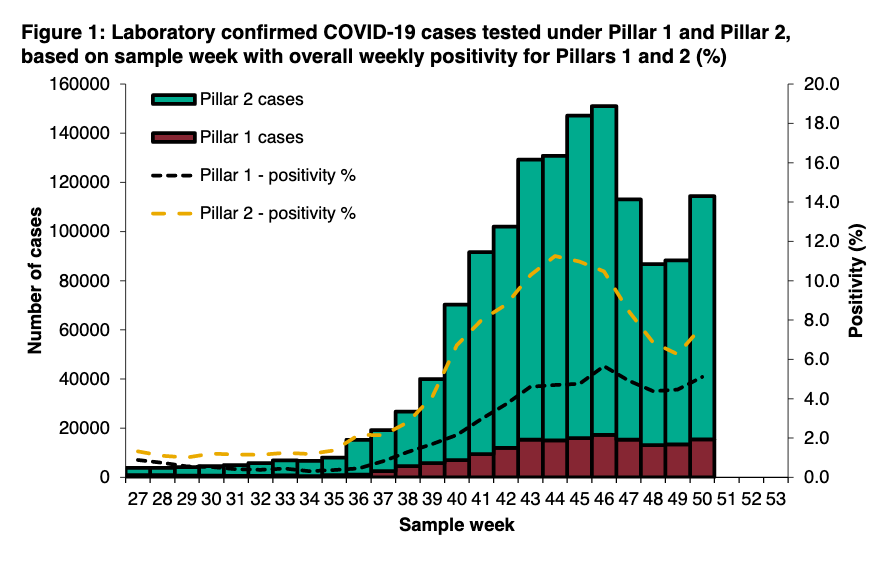
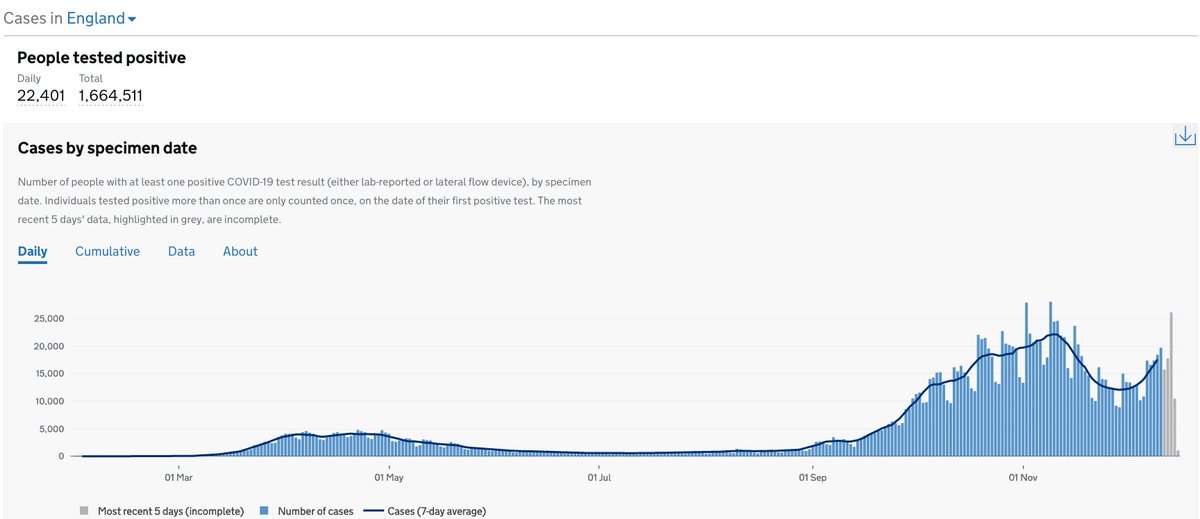
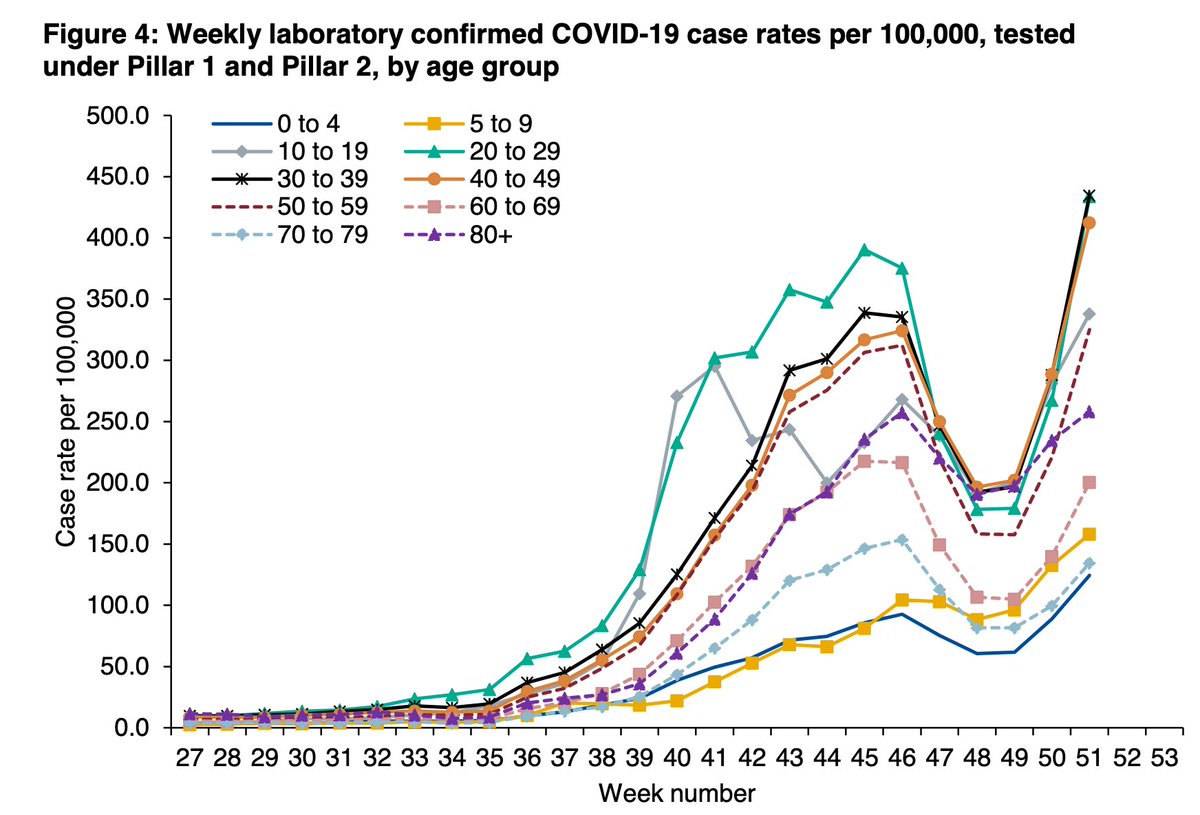
As the gov.uk dashboard has been telling us, cases are now well above the second wave peak and despite increased use of LFDs, positivity is also rising fast. 

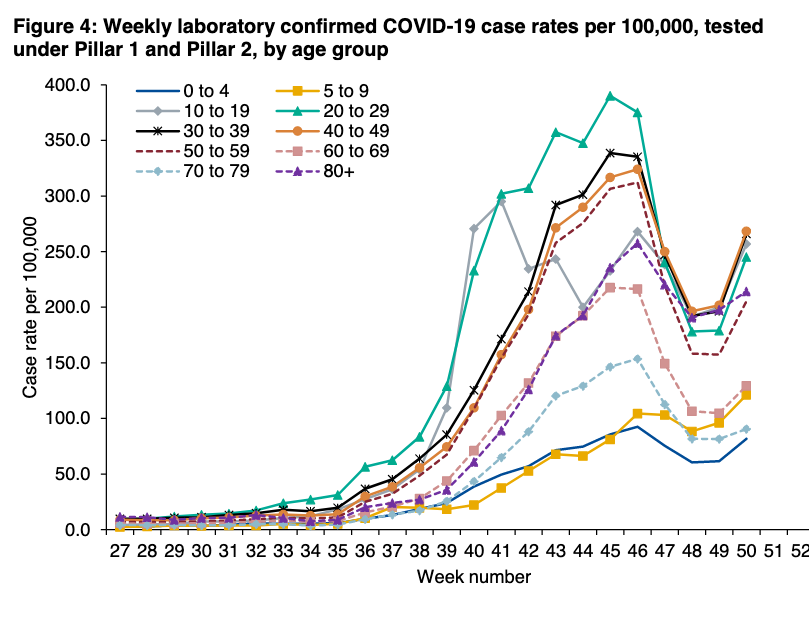
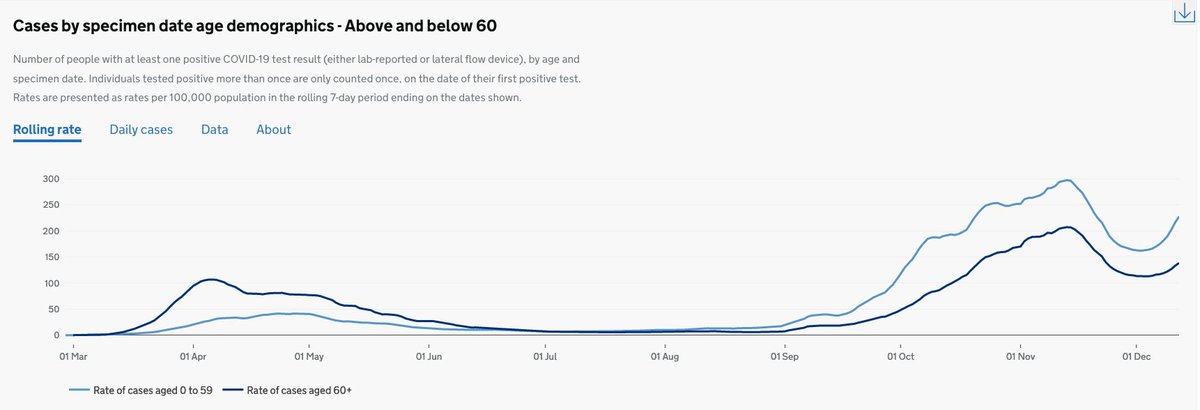
Cases rising in all age groups, particularly 20-59yrs and now there looks to be relatively steep rises in 60-69yr olds.
These are the key figures.
Contrast the South/East with Midlands/North.
But we know the new variant is found across England, and with the travel around Christmas it's v likely the N/Midlands will see more steeply rising case rates in coming weeks
Contrast the South/East with Midlands/North.
But we know the new variant is found across England, and with the travel around Christmas it's v likely the N/Midlands will see more steeply rising case rates in coming weeks


Here's the map by upper tier local authority.

The data show rising case rates among all ethnicities, within ongoing differences in case rates between different ethnic groups.
And as with previous weeks, the differences in infection rates between deprivation groups much less marked among young people than previous weeks.
And as with previous weeks, the differences in infection rates between deprivation groups much less marked among young people than previous weeks.


Slight rise in reported COVID incidents/outbreaks among care homes

And a big fall in hospital related episodes - this may be partly due to fewer being reported to PHE but it's really welcome.

School incidents persisted to the end of term.

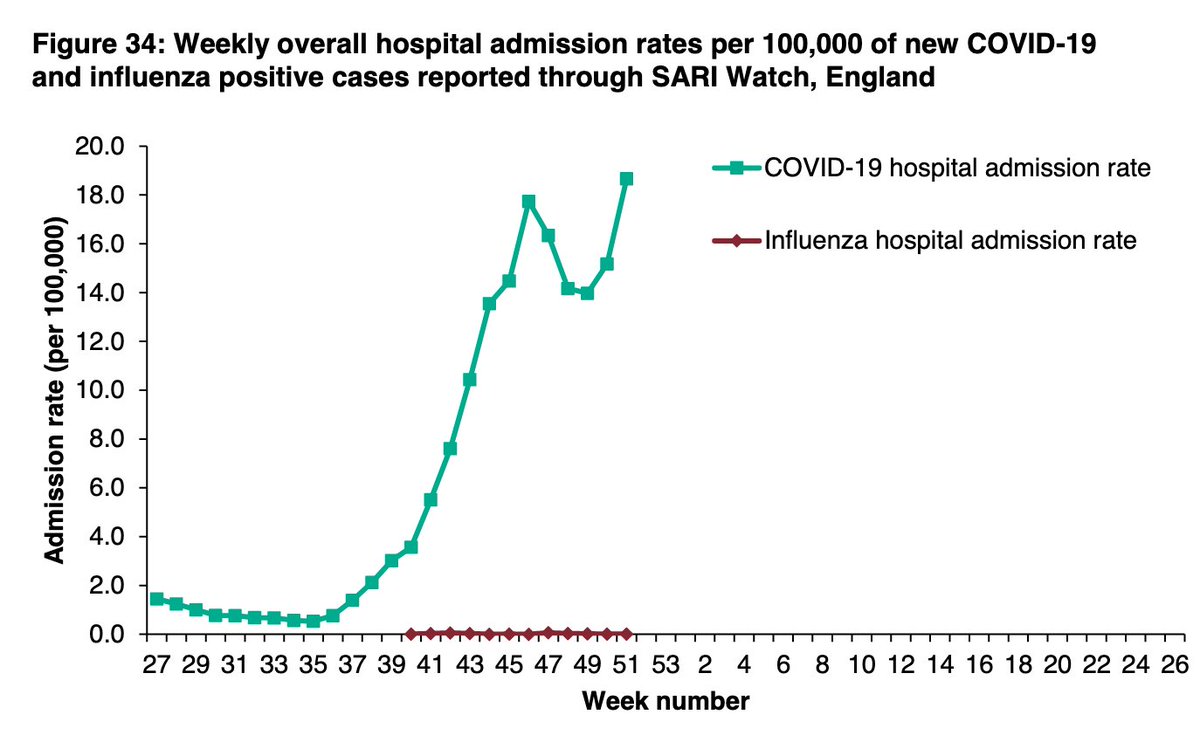
But this is why we're all entering another period of lockdown. Admissions simply haven't had the chance to drop enough in the North/Midlands, and their rocketing up in the SE/London.

Nor have ICU admissions. London is hugely worrying and other regions will likely follow.


And as case rates rise in those over 60yrs, so will admission to hospital and ICU (NB - younger people also still can get really sick - look at 15-44y/o ICU admissions)


Finally, the dip in deaths seems to be plateauing - both weekly data and daily data.


All the hand washing, social restrictions, and mask wearing is still reaping benefits for flu rates - there was just one admission recorded in the week and vaccination rates are highest ever and still climbing.


I hope everyone can find some time to switch off over the next couple of weeks, and a huge thank you to all those across health/public health/care/essential services that will still be looking after us.
It'll be a tough few months but there's light at the end of it all.
It'll be a tough few months but there's light at the end of it all.
PHE surveil rpt @felly500 @deb_cohen @martinmckee @carolecadwalla @mgtmccartney @ADPHUK @Jeanelleuk @fascinatorfun @profchrisham @petermbenglish @HPIAndyCowper @Davewwest @HSJEditor @KateAlvanley @IndependentSage @nedwards_1 @SamanthaJonesUK @ewanbirney @FurberA @Dr_D_Robertson
And taking some leave at the moment but can't help check the surveillance report, plus will probably glance at the T&T data later. Will share when/if have looked.
• • •
Missing some Tweet in this thread? You can try to
force a refresh