Who is in intensive care and where are they? A thread.
The Intensive Care National Audit & Research Centre @ICNARC have just published their report on COVID-19 patients admitted to ICU/HDU in England, Wales, and Northern Ireland.
icnarc.org/Our-Audit/Audi…
The Intensive Care National Audit & Research Centre @ICNARC have just published their report on COVID-19 patients admitted to ICU/HDU in England, Wales, and Northern Ireland.
icnarc.org/Our-Audit/Audi…
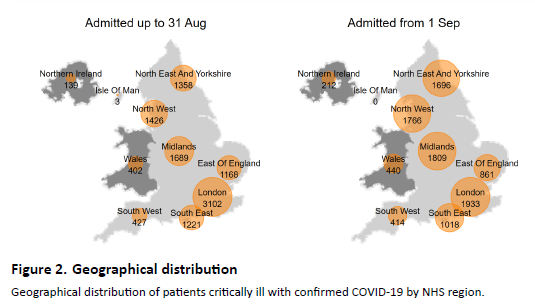
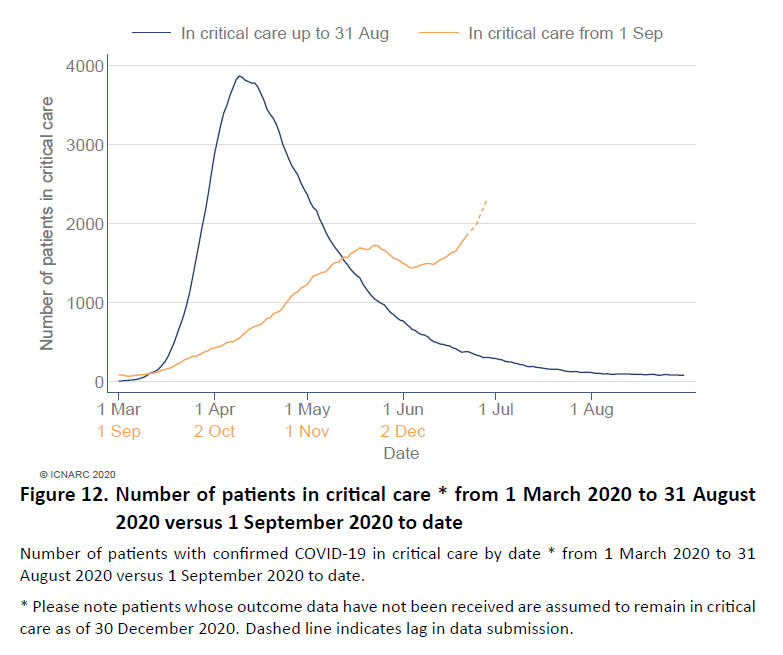
It looks at two periods: up to 31 August (including the devastating first wave), and 1 September - 30 December. There is a lag in reporting, so not all patients are recorded in the Sep-Dec figures.
Remember, these are patients that are *very ill* requring intensive care.
Remember, these are patients that are *very ill* requring intensive care.
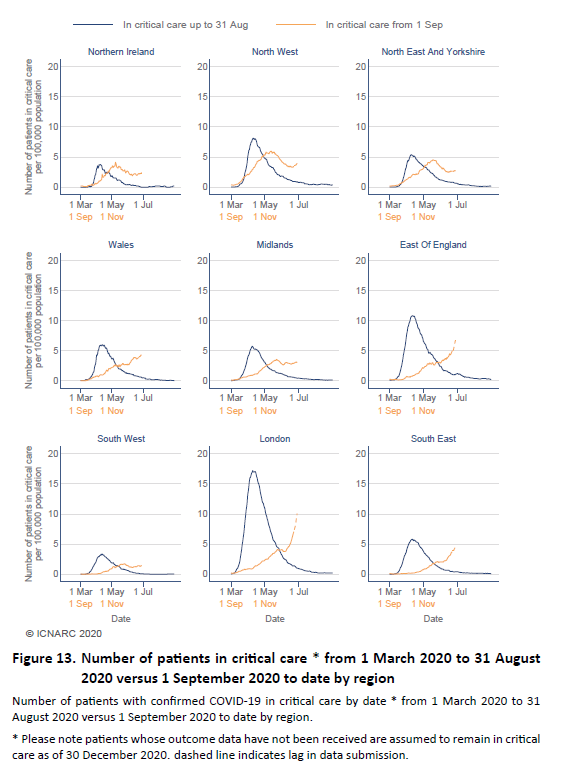
Wide distribution of patients across the country. 
This is the picture of admissions to intensive care in the past 14 days (2 weeks).
From 1 Sep - 30 Dec, there are around 17 weeks.
So if things were the same we would expect 2 / 17 = 12% in the last 14 days.
In London, 716/1933 (*37%*) patients admitted in the past 2 weeks.
From 1 Sep - 30 Dec, there are around 17 weeks.
So if things were the same we would expect 2 / 17 = 12% in the last 14 days.
In London, 716/1933 (*37%*) patients admitted in the past 2 weeks.
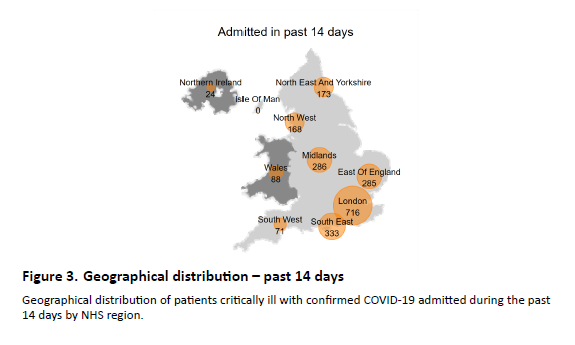
In the South East, 333/1018 = 33%
E. England, 285/861 = 33%
Wales 88/440 = 20%
South West, 71/414 = 17%
Midlands, 286/1809 = 16%
N. Ireland 24/212 = 11%
NE & Yorkshire, 173/1696 = 10%
North West, 168 / 1766 = 10%
E. England, 285/861 = 33%
Wales 88/440 = 20%
South West, 71/414 = 17%
Midlands, 286/1809 = 16%
N. Ireland 24/212 = 11%
NE & Yorkshire, 173/1696 = 10%
North West, 168 / 1766 = 10%
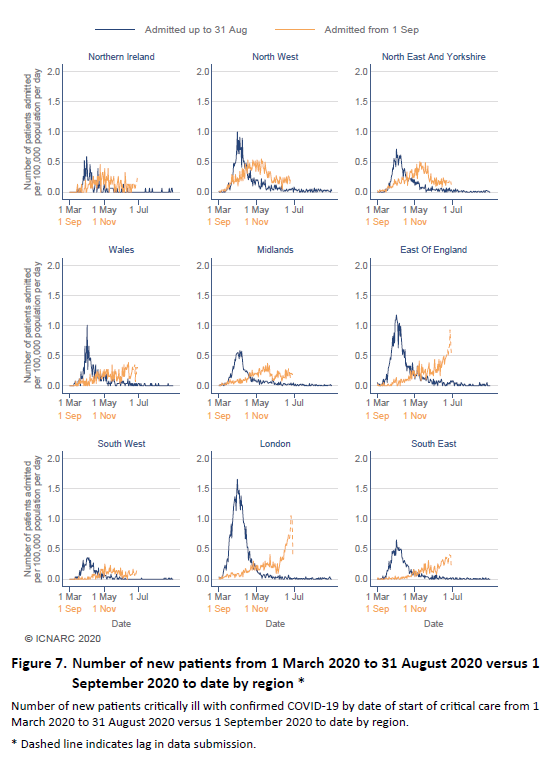
The orange lines show the trajectories in each region (compared to the blue line for the start of the epidemic).
London / South East / East of England showing exponential-type growth
London / South East / East of England showing exponential-type growth
The problem with ICU patients is that they stay in hospital for a long time. So there is a cumulative effect - it's not just admissions, it's how many people *remain* in ICU. These aren't patients who are in for the day. They accumulate increasing pressure on ICUs.
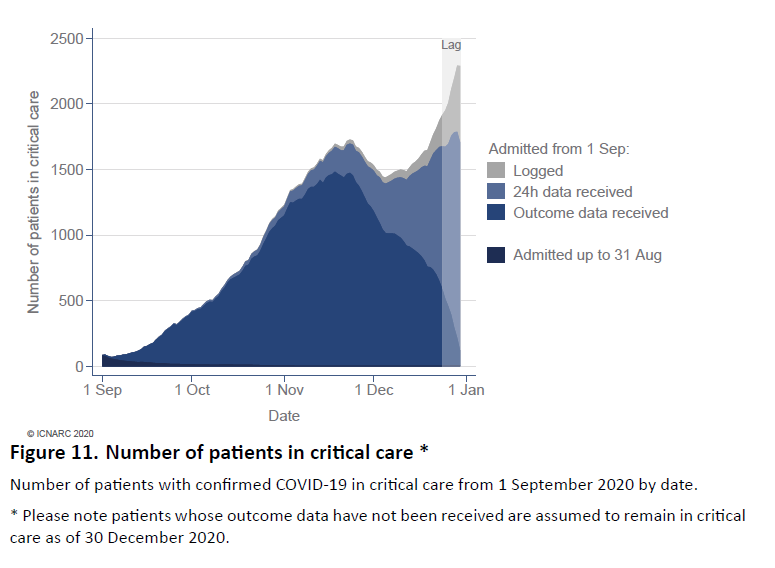
Here are the ICU patients *in hospital* for each region.
*All regions* are increasing.
*All regions* are increasing.
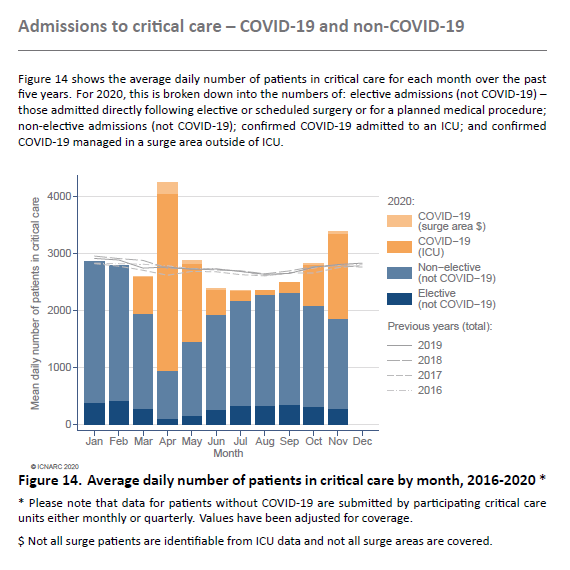
In April, we had many ICU admissions but *very few* non-COVID ICU patients. Now we have many more. This increases pressure on ICUs. Note December data yet to come in this chart.
And who are these patients?
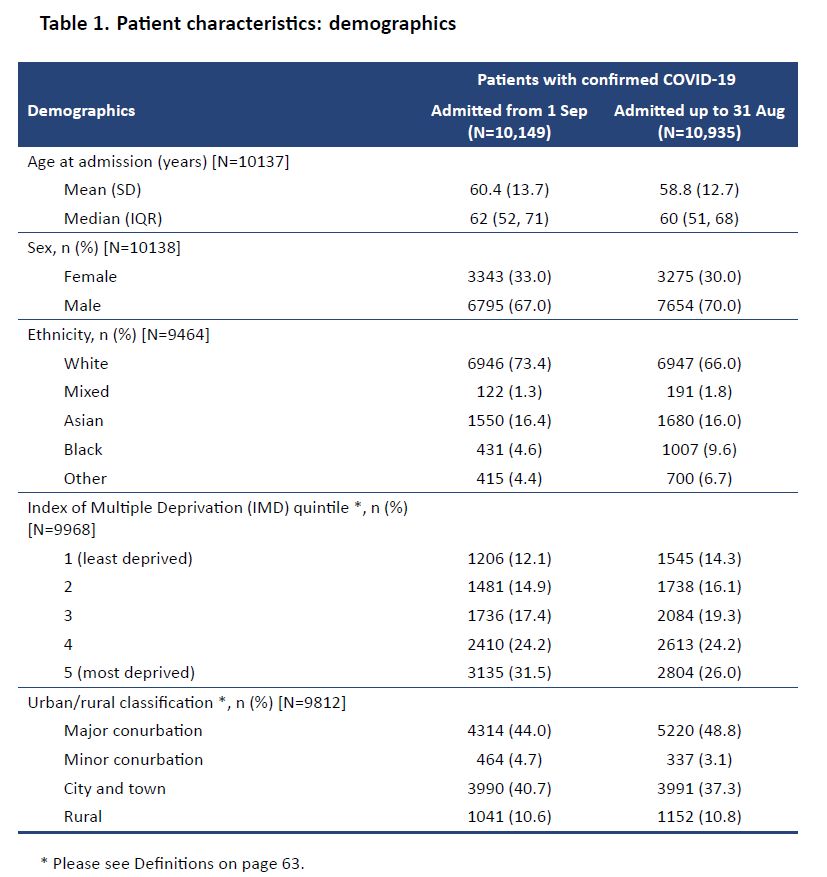
This is how old they are. You can look at average age (the mean) or the middle person's age when lined up from youngest to oldest (the median). Either of these is around 60 years old.
You can also look at what is called the inter-quartile range (IQR)...
You can also look at what is called the inter-quartile range (IQR)...
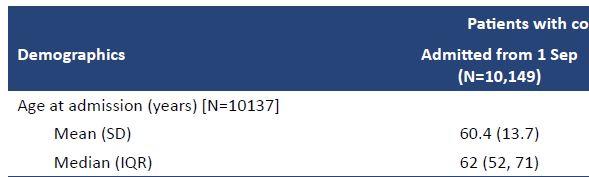
That shows that 25% of ICU admissions are *52 or younger*.
This is not just a disease of older people.
Remember, these are very ill patients in critical/intensive care. Many patients will die.
This is not just a disease of older people.
Remember, these are very ill patients in critical/intensive care. Many patients will die.
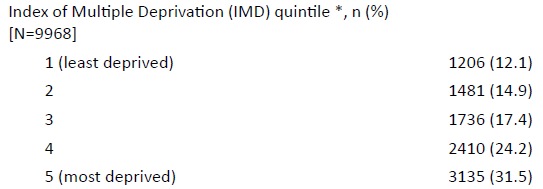
It also does not affect people equally. We can look at admissions to ICU by deprivation.
If a 'fair' disease, we would expect 20% of ICU admissions to be in each IMD group (1-5).
Instead, we see 31% in the most deprived group and 12% in the least deprived group.
If a 'fair' disease, we would expect 20% of ICU admissions to be in each IMD group (1-5).
Instead, we see 31% in the most deprived group and 12% in the least deprived group.
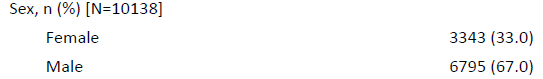
It also disproportionately affects men. Two thirds of ICU admissions are males.
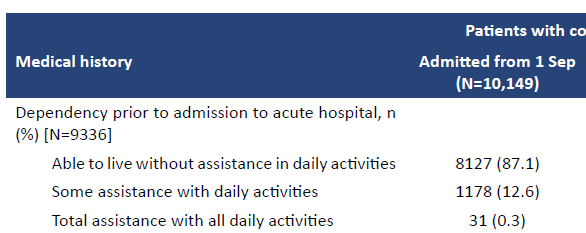
And the vast majority were living unaided before COVID.
87% living without any assistance.
They are now in intensive care.
87% living without any assistance.
They are now in intensive care.
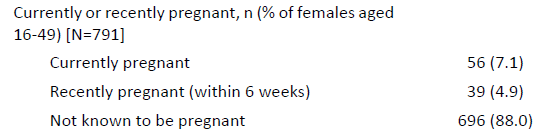
Over 10% of 16-49 year old women admitted to ICU are or had recently been pregnant.
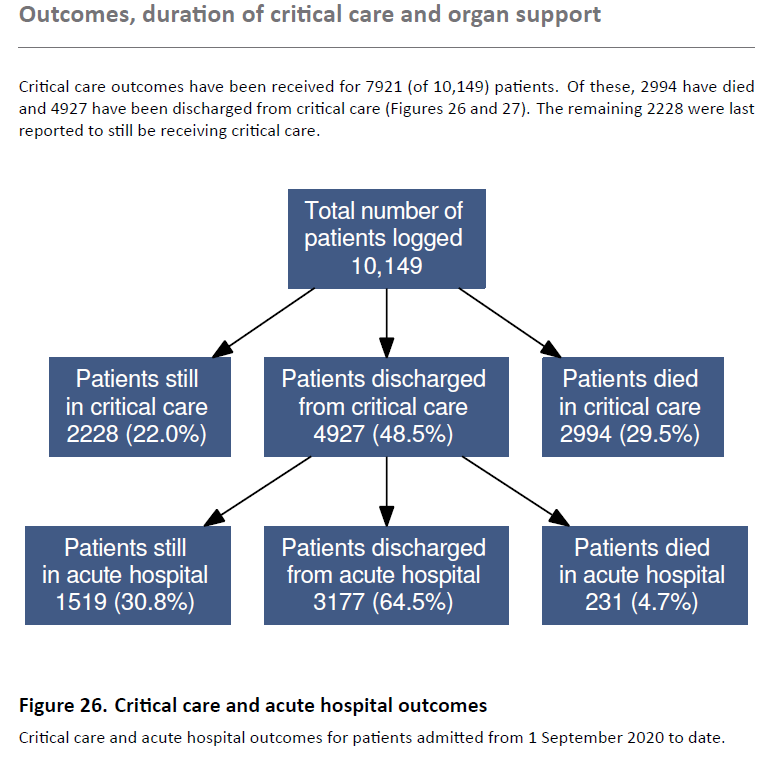
Around one third of ICU admissions sadly died.
This is a dire situation. The Government needs to introduce more stringent measures to prevent this becoming even worse.
Schools should remain closed until we have this situation under control, R is reduced to below 1, and we have regained capacity in hospitals.
Schools should remain closed until we have this situation under control, R is reduced to below 1, and we have regained capacity in hospitals.
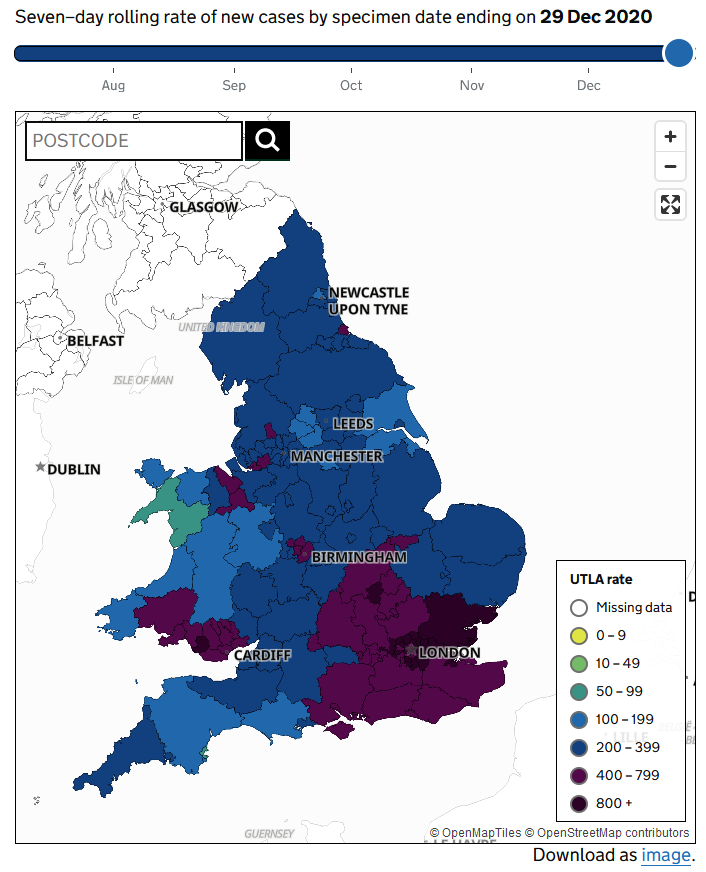
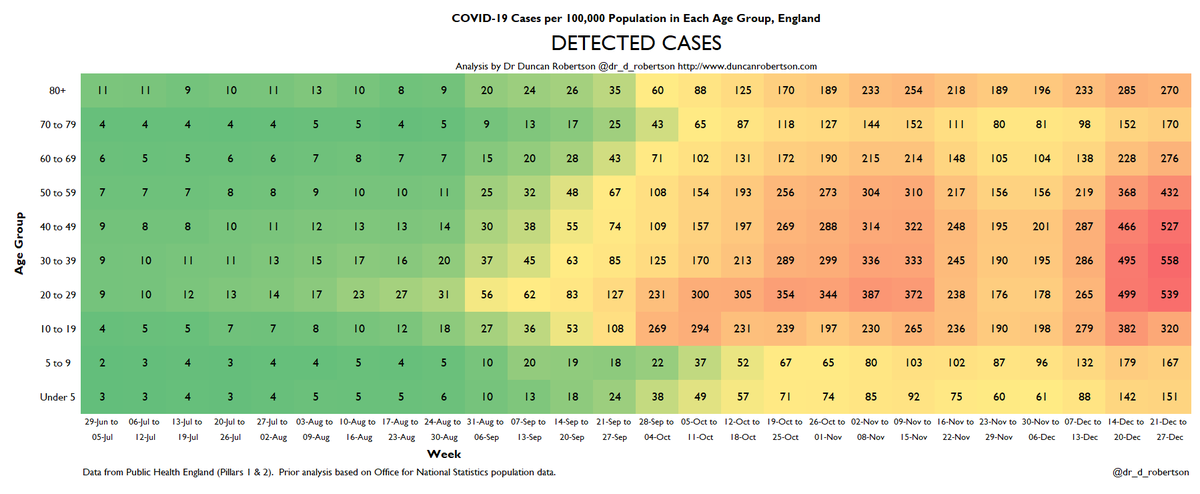
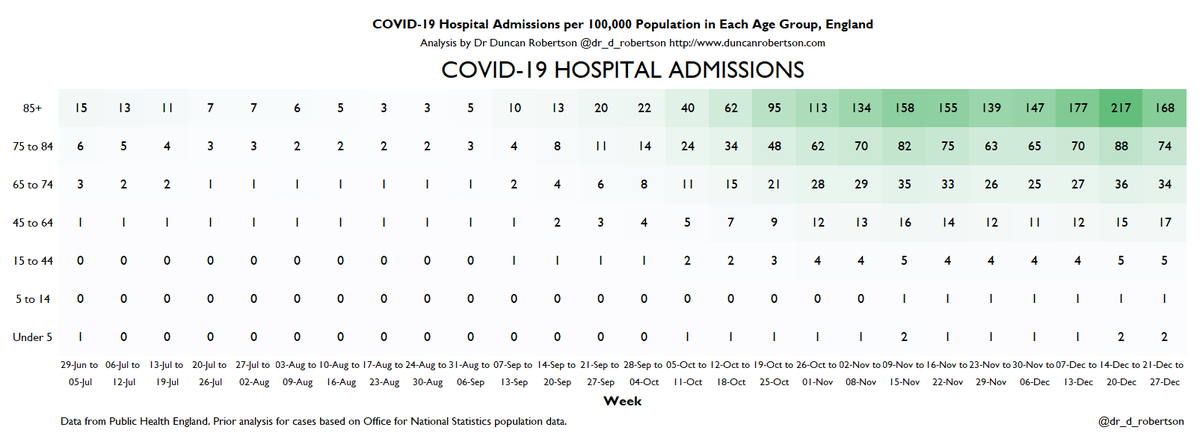
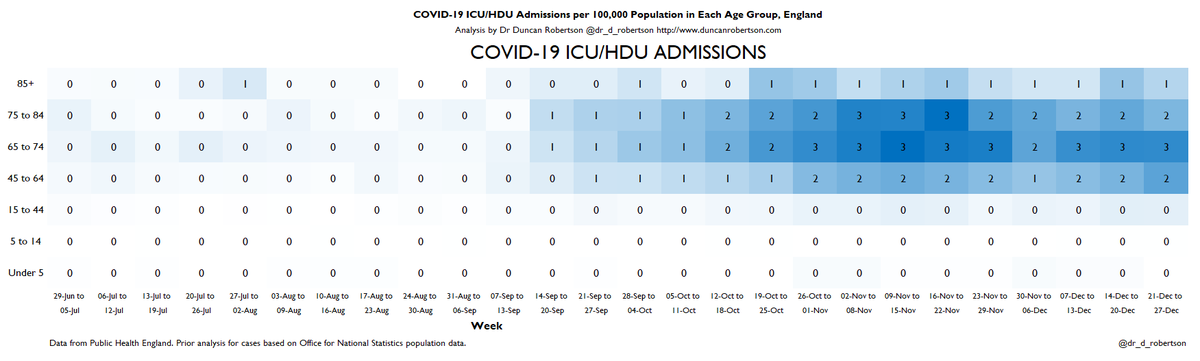
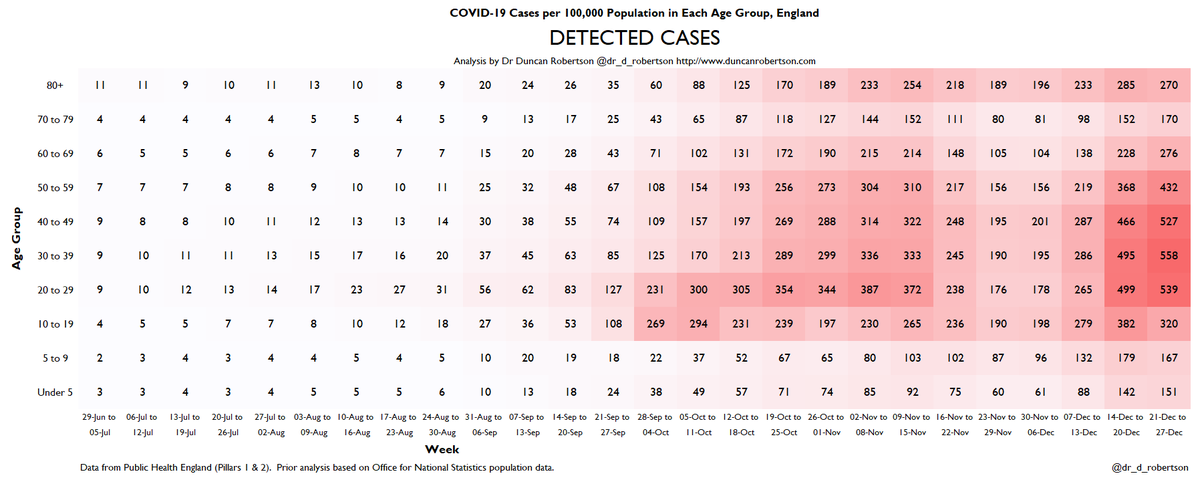
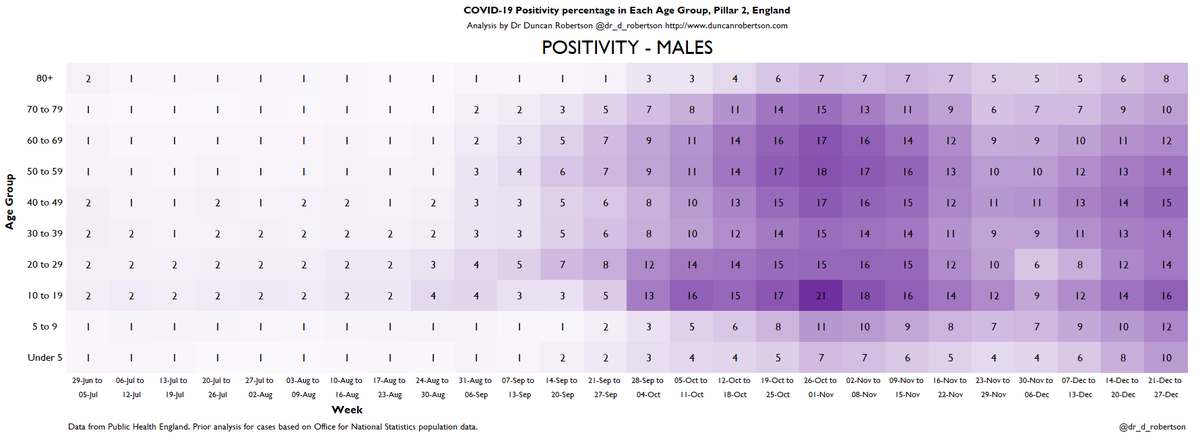
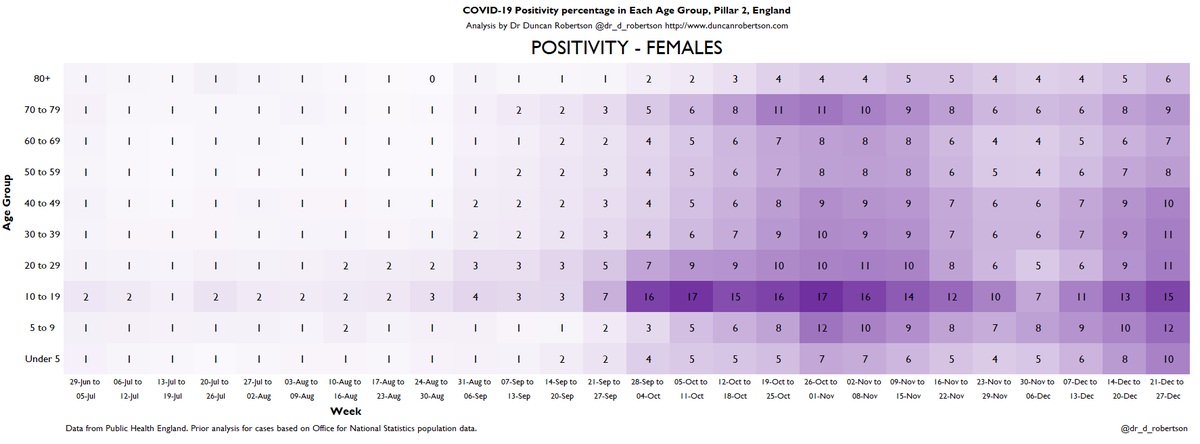
For those wanting to keep track of the epidemic in the UK, I produce heatmaps of detected cases, positivity, hospitalizations, and ICU admissions each Thursday. I pin these tweets to my profile. Here is the latest. Follow me to get the latest versions.
https://mobile.twitter.com/Dr_D_Robertson/status/1344684847185408000
• • •
Missing some Tweet in this thread? You can try to
force a refresh