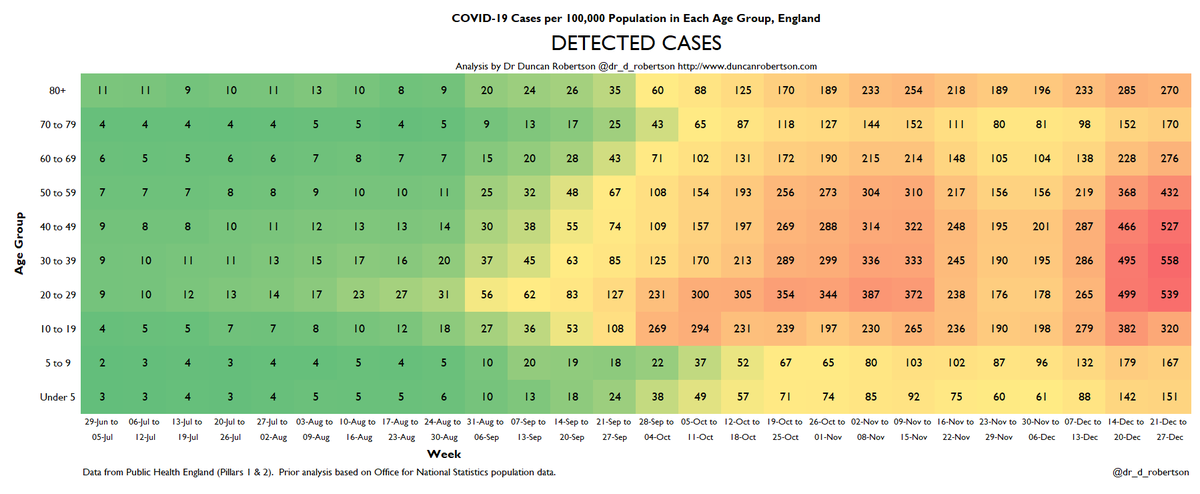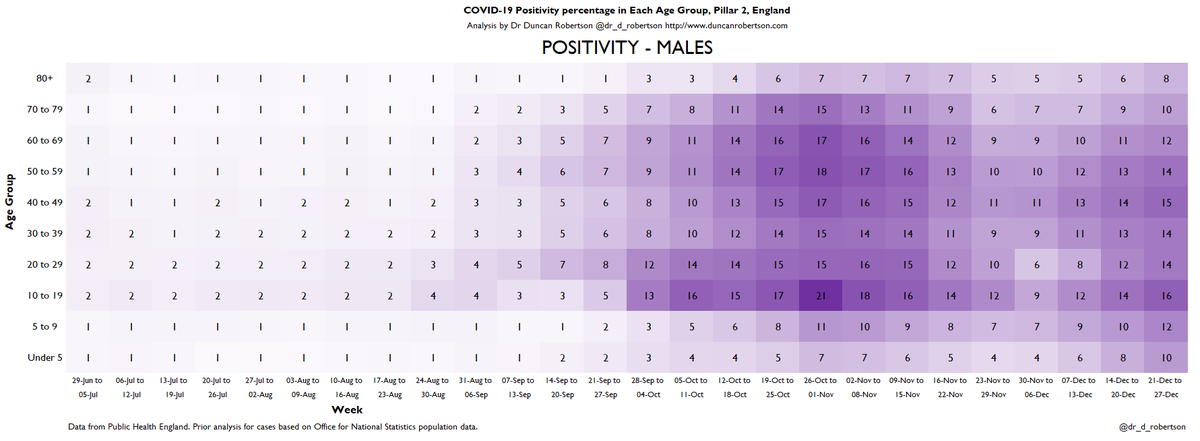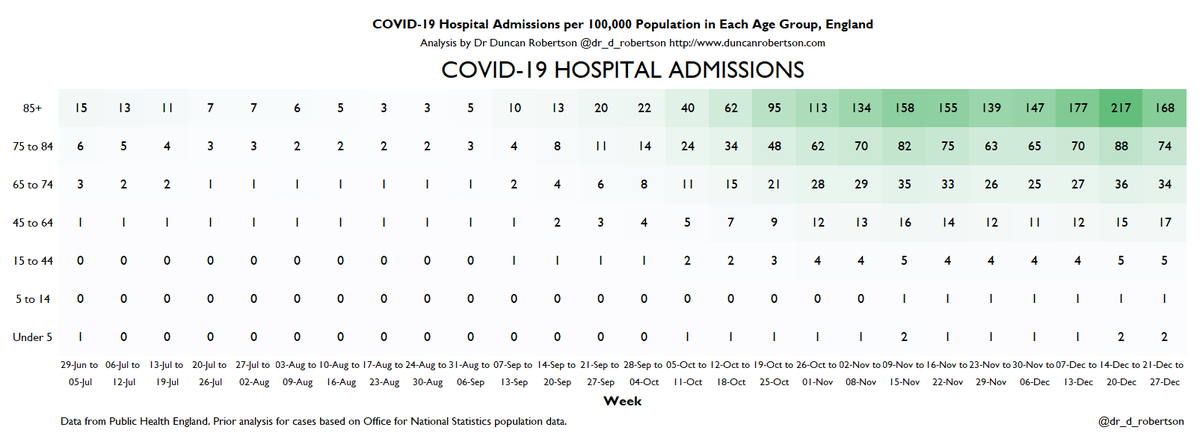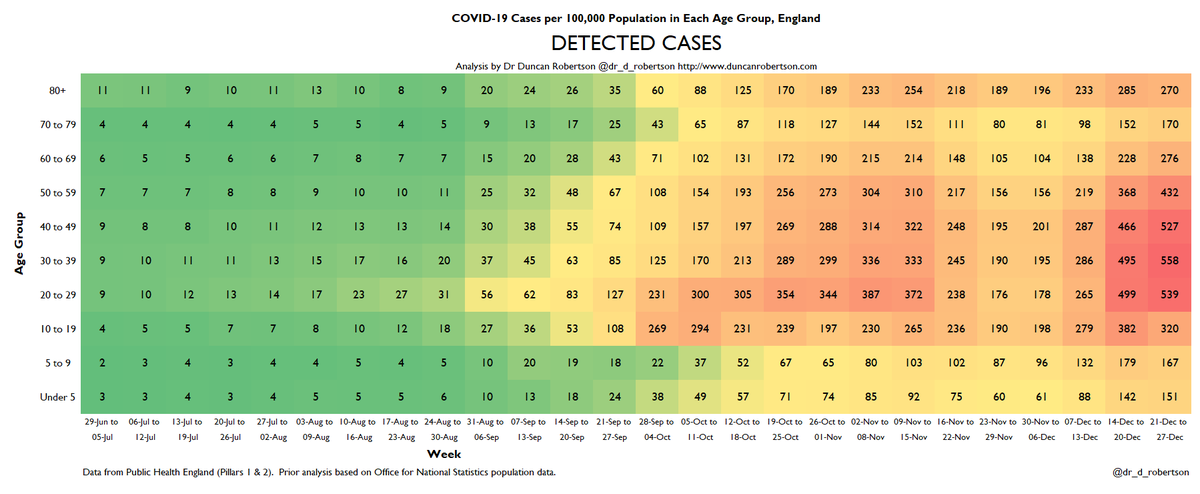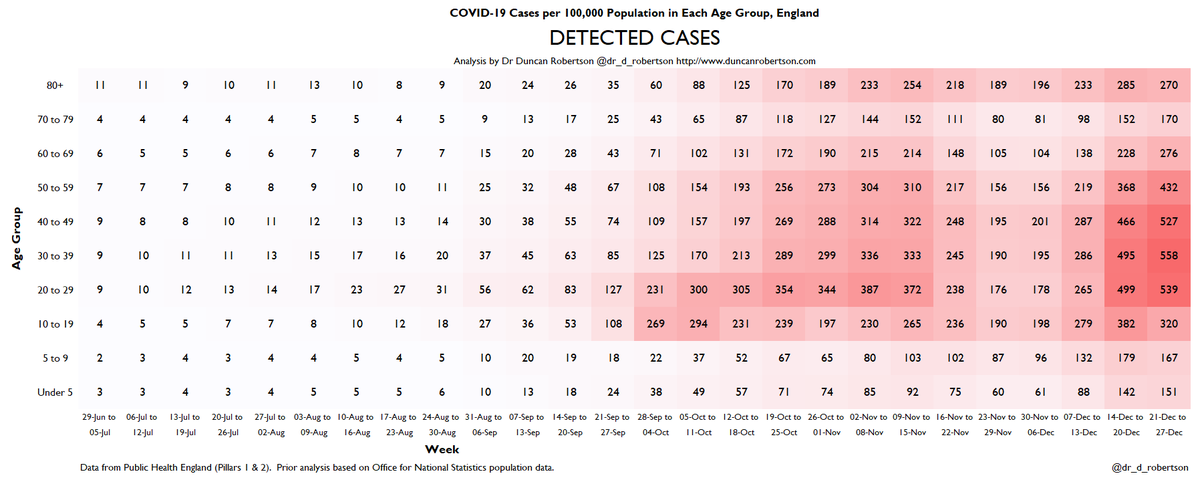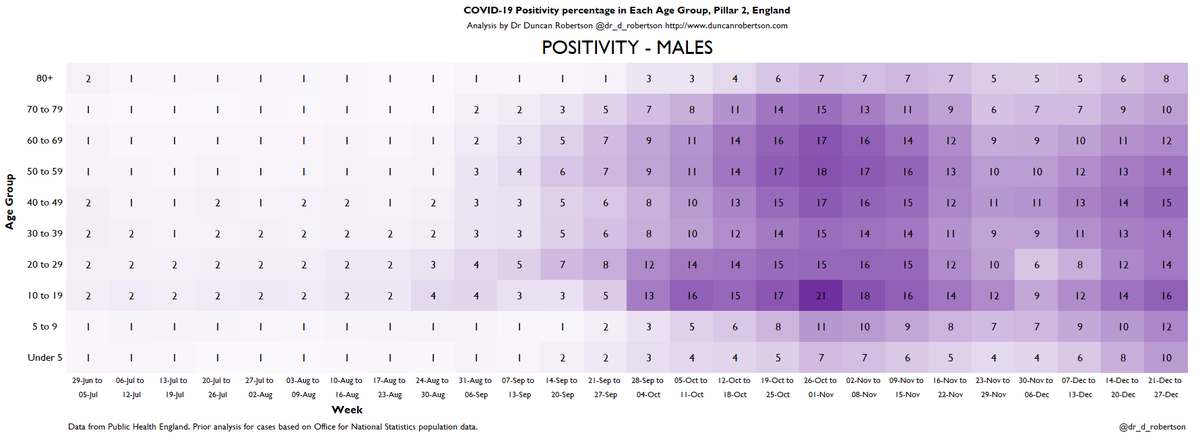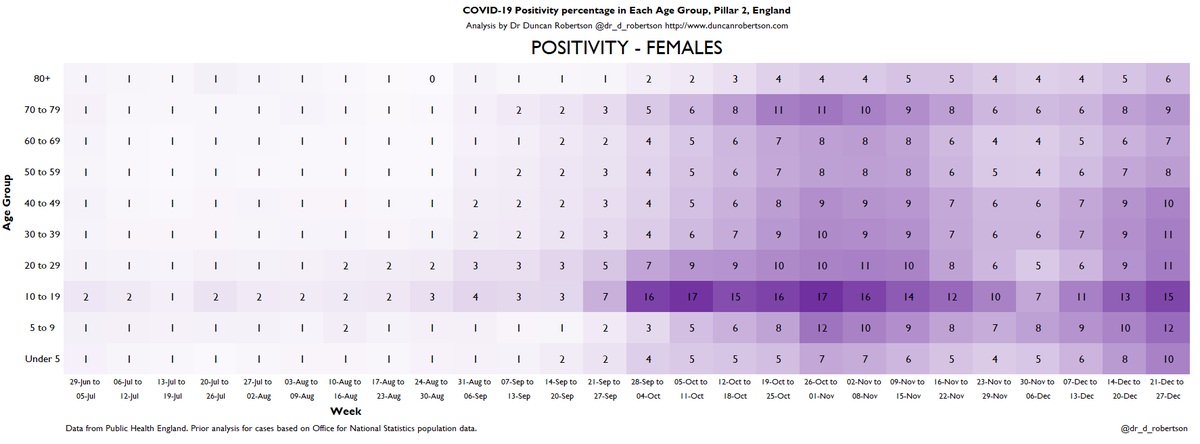
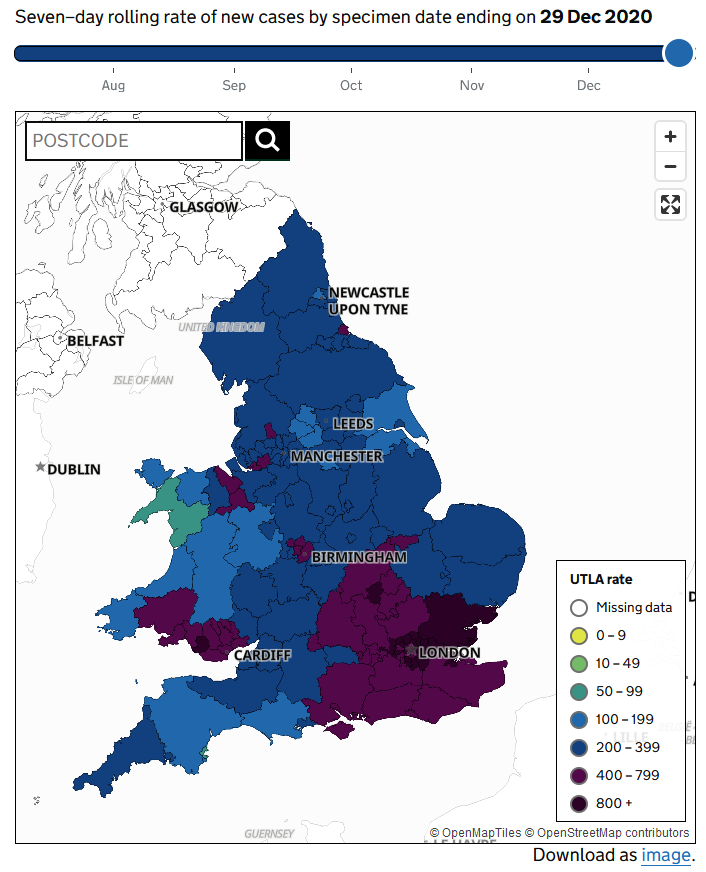
Case rates now and 3 months ago when SAGE suggested a 'circuit breaker' news.sky.com/story/coronavi…
Data from coronavirus.data.gov.uk
A short thread.

Data from coronavirus.data.gov.uk
A short thread.

22 September: the day after the SAGE meeting.
6,300 cases (7 day average)
354 patients admitted to hospital (7 day average)
1,634 patients in hospital (7 day average)
204 patients in mechanical ventilation beds (7 day ave)
34 deaths/day (7 day ave, within 28 days of +ve test)
6,300 cases (7 day average)
354 patients admitted to hospital (7 day average)
1,634 patients in hospital (7 day average)
204 patients in mechanical ventilation beds (7 day ave)
34 deaths/day (7 day ave, within 28 days of +ve test)

20 October
21,866 cases
1,251 patients admitted to hospital
8,499 patients in hospital
733 ventilated patients
217 deaths/day
21,866 cases
1,251 patients admitted to hospital
8,499 patients in hospital
733 ventilated patients
217 deaths/day

17 November
19,873 cases
1,676 patients admitted to hospital
17,120 patients in hospital
1,407 ventiated patients
448 deaths/day
19,873 cases
1,676 patients admitted to hospital
17,120 patients in hospital
1,407 ventiated patients
448 deaths/day

15 December
30,636 cases
1,920 patients admitted to hospital
18,141 patients in hospital
1,315 ventilated patients
459 deaths/day
30,636 cases
1,920 patients admitted to hospital
18,141 patients in hospital
1,315 ventilated patients
459 deaths/day

29 December (latest cases data - some figures yet to be reported)
79,818 cases (specimen date cases)
2,886 patients admitted to hospital (England only, 29 Dec)
23,823 patients in hospital (28 Dec figure)
1,847 ventilated patients (28 Dec figure)
524 deaths/day
79,818 cases (specimen date cases)
2,886 patients admitted to hospital (England only, 29 Dec)
23,823 patients in hospital (28 Dec figure)
1,847 ventilated patients (28 Dec figure)
524 deaths/day

We could wait for cases, hospitalizations, ICU patients in hospital, and deaths all to increase, or we could do something to stop it.
Compare cases when SAGE recommended a circuit breaker to what we have now.
Then act.

Compare cases when SAGE recommended a circuit breaker to what we have now.
Then act.


• • •
Missing some Tweet in this thread? You can try to
force a refresh

