2019 had the lowest ever mortality rates for all age groups in history and dropped ~5% (huge for one year) from an already record low 2018.
Mortality rates for most age groups (particularly those 45+) have dropped substantially in just the last 5 years. For example, both men and women aged 50-54 have seen mortality rates drop more than 20% since 2015 (from 2.6 per 1000 to 2)
So, after years of substantial decrease in mortality rates, 2020 is looking to be the best ever year for women under 65 and second best for men.
Total deaths will increase about 8000 in Sweden from 2019 to 2020. Nearly all of it has come from the 65+ age group. Data again through early dec
2019 - 72700
2020 - 79700
While this increase of 10% is significant, the age 65+ population has increased substantially in the past few years.
The mortality rate for 65+ will be around the 2015-2018 average.
β’ β’ β’
Missing some Tweet in this thread? You can try to
force a refresh
I gave masks the benefit of the doubt in the spring/summer of 2020. I have since changed my mind and see no scenario where it makes sense to wear them in public.
Even if they provided 100% protection, I believe masks to be harmful. An explanation below πππ
Let's say masks provide 100% protection to both the wearer and others (perhaps non-masked individuals) in close proximity. This is perhaps the worst scenario.
The immune system requires a consistent influx of both microbes and viruses to remain trained.
Halting the exposure to microbes and viruses is extremely harmful in the long run and leaves you exposed to enormous risk in the future.
Without training, you will become susceptible to even weaker microbes that your immune system would have normally handled with ease.
@denisrancourt I believe the efficacy to be 0. It is trivially easy to pull off paper efficacy of >90%. Heres how done.
1. Have no one deliberately exposed to the virus 2. Only test those that report symptoms 3. Give a placebo (saline) shot with no side effects
..
@denisrancourt 4. Fail to run a test group with no shot 5. Fail to run a test group with non-pharma intervention such as exercise, diet and vitamin D 6. Fail to run test group with on related immune boost 7. Partipants knew which group they were in based on the side effects.
....
@denisrancourt 8. Many participants openly admitted in public online forums to getting antibody tests to determine which group they were in 9. Most likely everyone wanted the trial to succeed. 10. Knowing which group you were in, you could just not get tested if in the vaccine group
....
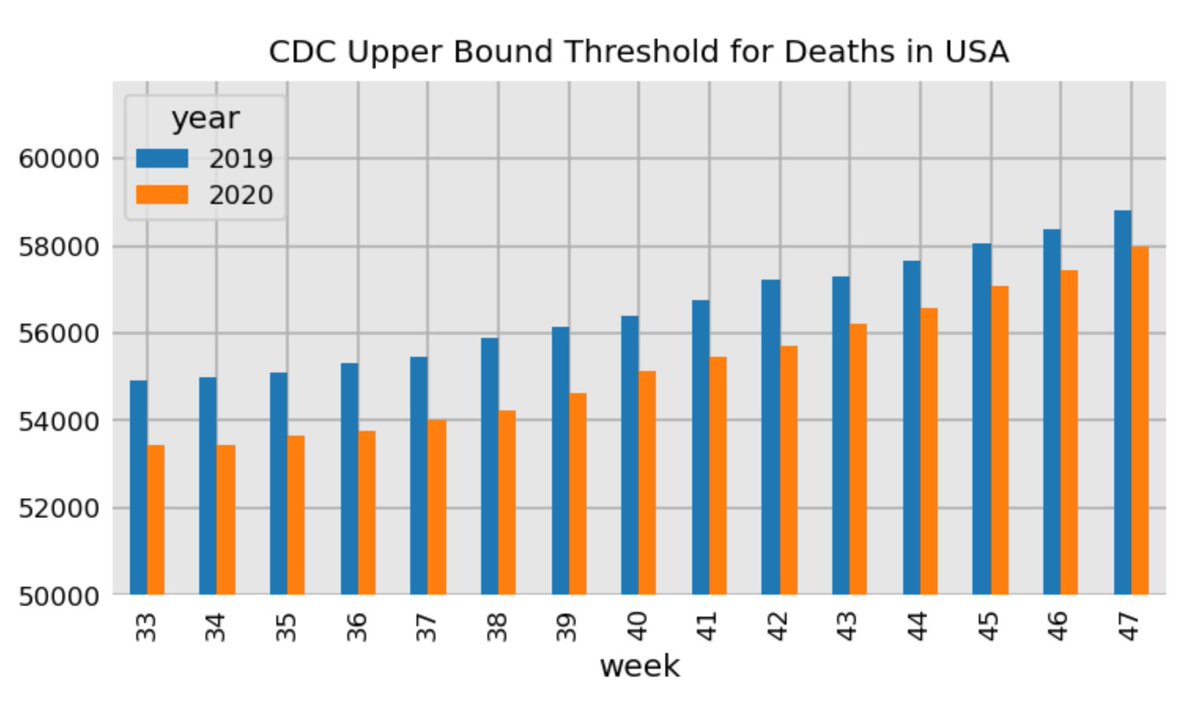
.@CDCgov - Why is your upper bound threshold for deaths less in 2019 than in 2020? This is extremely fishy to me.
It's overall 2.3% less for the same periods in 2019 vs 2020 or ~63k.
For those who want an explanation. The CDC uses this chart to estimate excess deaths, but the upper bound threshold in 2020 is 2.3% lower than it was for 2019. US population is growing.
Explanation of matplotlib "inches" - a tutorial thread
Inches is a relative term. You must know the figure dpi (dots per inch) and your screen's dpi to make sense of it. Default inline dpi is 72. Below figure is 5 x 2 "figure inches" or 360 x 144 pixels.
Using a screen ruler program (Onde Rulers) it actually measures as 2.2 x .98 "screen inches" on my screen and 324 x 144 pixels
Why not 360 x 144 pixels? Because figures are displayed in the notebook with setting bbox_inches set to 'tight' which trims some of the figure.