Consensus continues to conflate the inflation story, mixing and matching long-term and short-term charts to fit what is generally a secular inflation narrative.
Here are my two cents to make the distinction clear.
1)
Here are my two cents to make the distinction clear.
1)
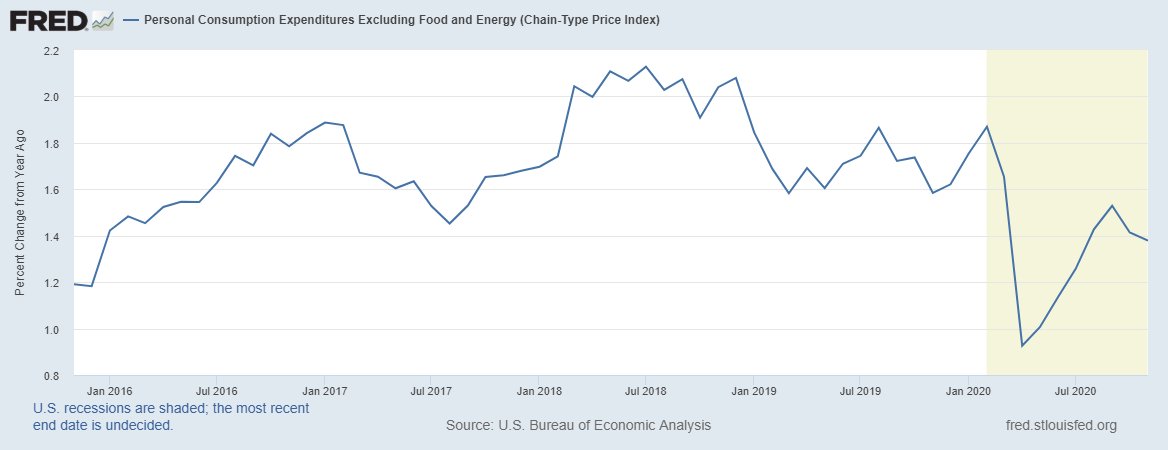
There are long-term, secular trends in inflation driven by trend economic growth, monetary policy & fiscal policy.
There are also short-term trends in inflation that are driven by the ups and downs in the manufacturing industry.
2)
There are also short-term trends in inflation that are driven by the ups and downs in the manufacturing industry.
2)
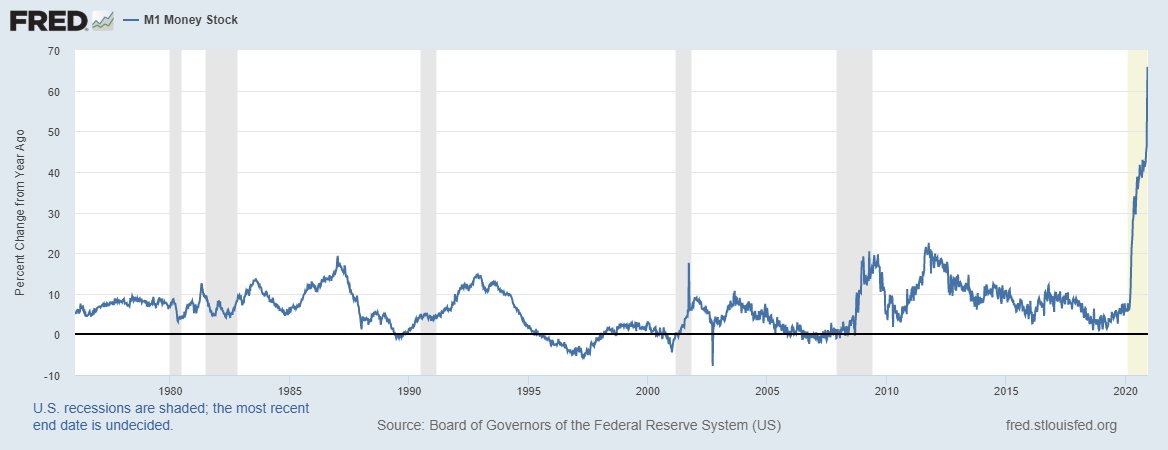
If we look at any of the critical long-term monetary variables, a secular shift in inflation is not yet in the cards.
The money multiplier "m" continues to fall which means the new money supply is coming from fiscal spending (finance day to day needs) and QE from non-banks.
3)
The money multiplier "m" continues to fall which means the new money supply is coming from fiscal spending (finance day to day needs) and QE from non-banks.
3)

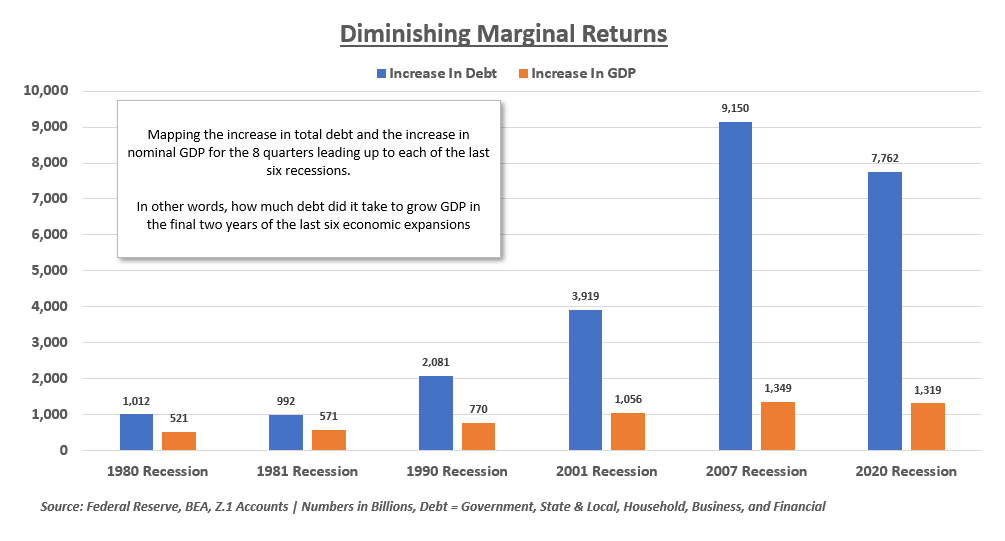
A declining "m" means the new money will have very low velocity as we are generally using interest-bearing debt to finance non-income generating uses like consumption
Little if any of the new $ is used for productive investment that generates an income above the int expense
4)
Little if any of the new $ is used for productive investment that generates an income above the int expense
4)
One of the common arguments is that we cannot define money and M2 is not correct.
The money multiplier is declining based on virtually all money aggregates.
5)
The money multiplier is declining based on virtually all money aggregates.
5)

Secondly (this will make some mad) is that velocity is crashing, in line with the expectation that financing consumption LOWERS V
We know nGDP is the best economic series we have
If you don't like V, then present a monetary aggregate against nGDP that shows V is increasing
6)
We know nGDP is the best economic series we have
If you don't like V, then present a monetary aggregate against nGDP that shows V is increasing
6)

So the two main monetary variables that define our economic system are showing no signs of a secular shift in inflation.
Could it happen? Sure, but not based on the current strategy of sending checks (financed by debt) to facilitate non-income generating consumption.
7)
Could it happen? Sure, but not based on the current strategy of sending checks (financed by debt) to facilitate non-income generating consumption.
7)
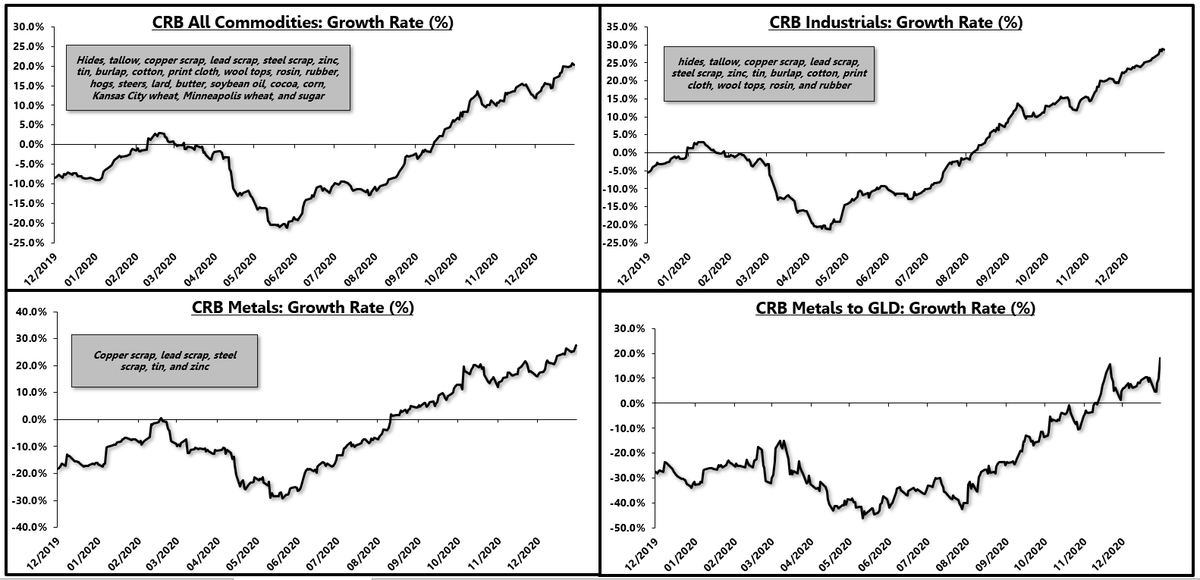
Now, in the short-term, the manufacturing sector is red hot, driven by a pent-up demand rebound in goods consumption.
Commodity prices are screaming which gives legs to "goods" inflation in the short-term.
8)
Commodity prices are screaming which gives legs to "goods" inflation in the short-term.
8)

This does not mean that inflation is here for decades to come
As soon as the manufacturing upturn fades, commodity prices will re-align with long-term trend growth, goods inflation will move back into the decade-long standing of deflation and we'll proceed with disinflation.
9)
As soon as the manufacturing upturn fades, commodity prices will re-align with long-term trend growth, goods inflation will move back into the decade-long standing of deflation and we'll proceed with disinflation.
9)

Long-term shift in the inflationary paradigm? No. Not yet based on the data and the trend in nGDP growth.
Short-term upturn in goods inflation driven by a manufacturing upturn across the globe? Yes. Absolutely yes.
10)
Short-term upturn in goods inflation driven by a manufacturing upturn across the globe? Yes. Absolutely yes.
10)
Lately there are a lot of investors using short-term cyclical charts to make the case for long-term inflation
It's important to recognize the difference between the trends
It can be hard to grapple with two opposing thoughts & trends but the distinction needs clarification
11)
It's important to recognize the difference between the trends
It can be hard to grapple with two opposing thoughts & trends but the distinction needs clarification
11)
• • •
Missing some Tweet in this thread? You can try to
force a refresh