It is difficult to change a 10-year trend.

Long-term expectations do not change as frequently as daily market fluctuations would make it seem.

A quick update on Treasury rates through the lens of the DKW model

*As of Dec. 31*

1/
In previous threads, I made the distinction between long-term secular trends in growth and inflation and shorter-term (2-6 quarters) trends in nGDP growth


2/
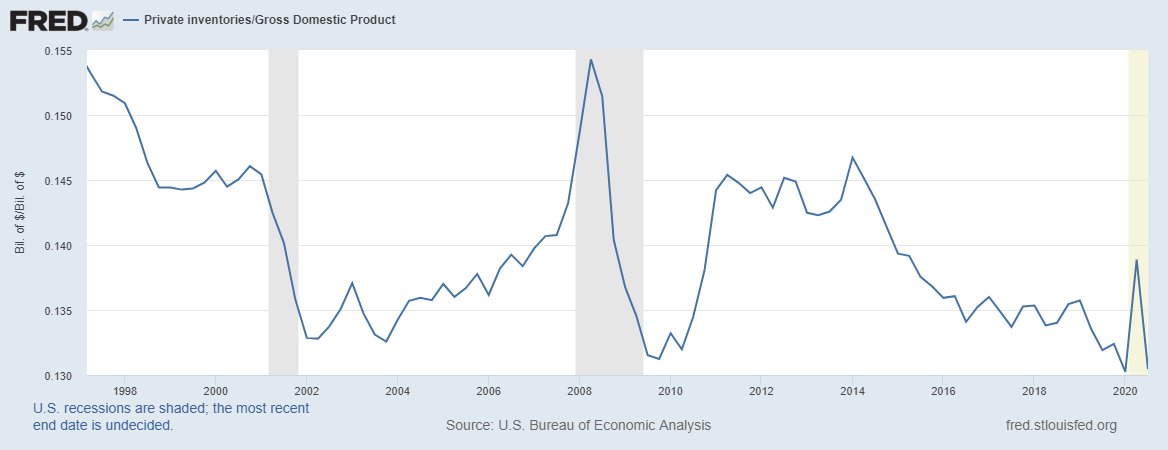
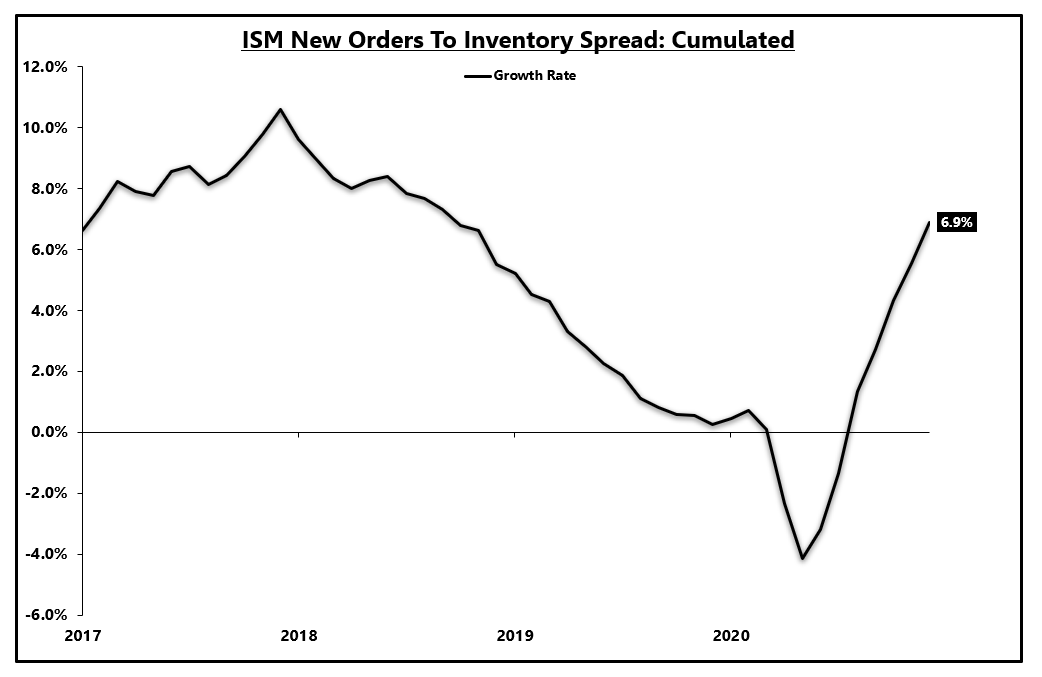
Right now, the long-term trends are unaltered because long-term trends just don't change that fast but we have a very strong cyclical upturn in the economy, centered primarily on the shift to goods consumption bolstering the manufacturing sector and industrial commodities.

3/
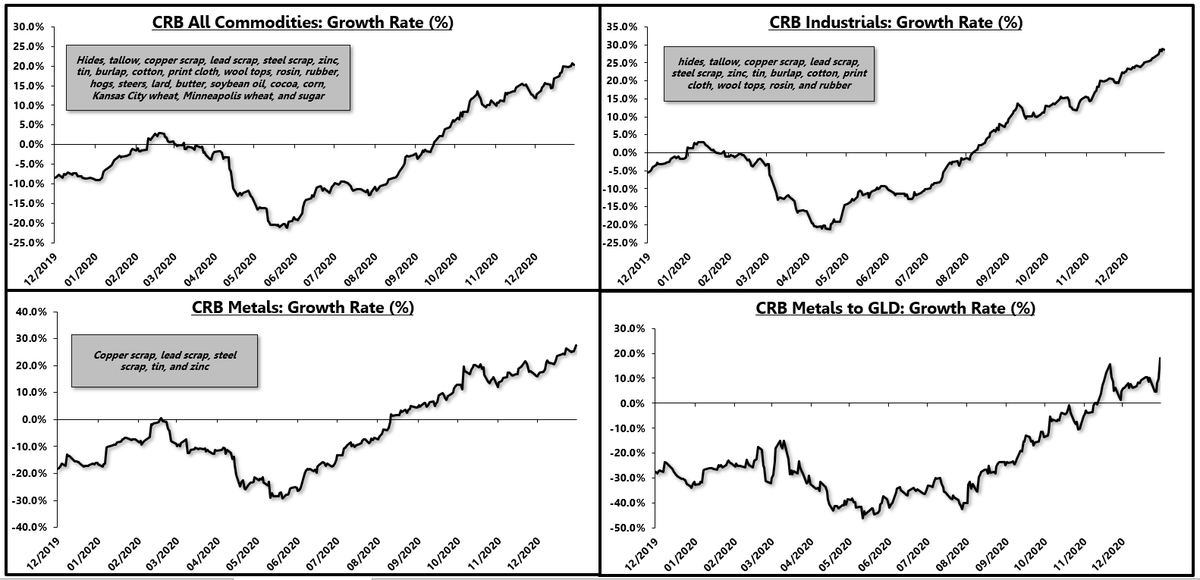
As long as the industrial sector continues to roar, TSY rates will have an upward bias as rates generally follow the trend in nGDP growth

A 10yr TSY has longterm expectations embedded in the rate so several qrters, while important, won't necessarily change the longterm trend

4/
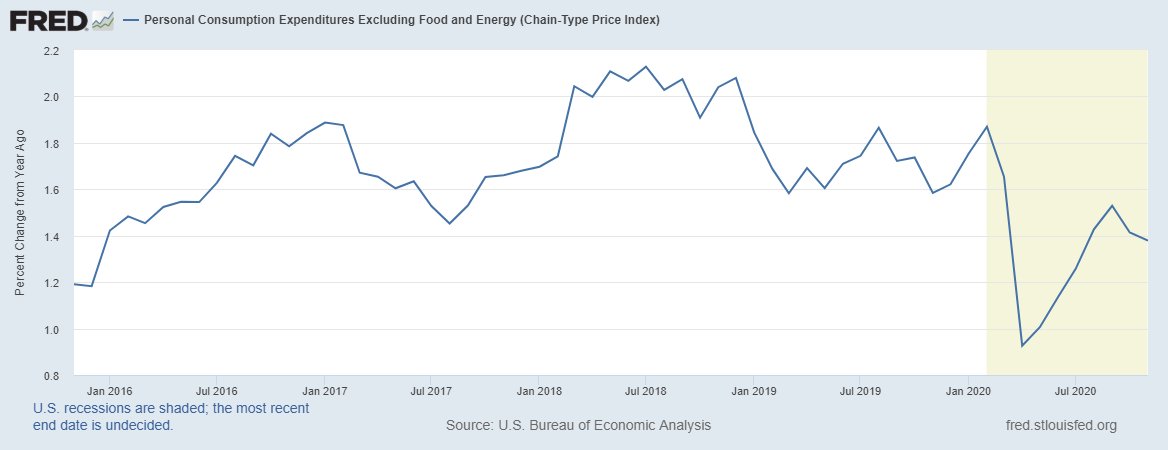
This is confirmed by the Dec update to the DKW model which breaks down *actual* inflation expectations, the expected real short-term rate (real growth), term premium, liquidity premium etc.

The DKW model is one of many models that is useful but has many limitations.

5/
As of Dec 31, according to the DKW model, inflation expectations are directionally rising, in line with the industrial upturn, but have only increase ~12bps from the summer low.

It is hard to alter a long-term trend with just a couple of quarters.

6/
Real growth expectations remain on the floor in the DKW model as (again) a transitory upturn in growth won't alter the 10-year average rate of growth all that much.

7/
So what is causing the bulk of the move in Treasury rates?

The real term premium.

Expectations for massive fiscal spending rightfully won't alter the economy's long-term growth prospects but do place extra risk on duration in the near term.

8/
Adding actual inflation expectations and the real ST rate expectations gives what I call the "fundamental" drivers of TSY rates which have increased cumulatively about 14bps since the summer.

This makes sense with the trend in nGDP growth.

9/
In short, the long-term trends that have caused TSY rates to decline for decades are still in place.

Weaker growth and lower inflation over the long-run will depress the risk-free rate.

In the short-term (2-6 quarters), you have to follow the direction in nGDP growth.

10/
Once this manufacturing upturn starts to fade (no signs yet) TSYs will be a great buy again as the next cyclical downturn in the economy will push the long-end to the zero-bound.

11/11
@R_Perli has more timely updates on this model and can perhaps shed some light on the January move in rates so far.

• • •

Missing some Tweet in this thread? You can try to force a refresh
 

Keep Current with Eric Basmajian

Eric Basmajian Profile picture

Stay in touch and get notified when new unrolls are available from this author!

Read all threads

This Thread may be Removed Anytime!

PDF

Twitter may remove this content at anytime! Save it as PDF for later use!

Try unrolling a thread yourself!

how to unroll video
  1. Follow @ThreadReaderApp to mention us!

  2. From a Twitter thread mention us with a keyword "unroll"
@threadreaderapp unroll

Practice here first or read more on our help page!

More from @EPBResearch

13 Jan
I have been discussing the trends in inflation lately.

Today's report showed more of the same.

Inflation is coming from the industrial upturn, concentrated in the goods sector while the services sector is showing declining rates of inflation.

1/
Headline inflation ticked up slightly and is mostly a balancing act between rising goods inflation and falling services inflation.

2/ Image
Goods inflation continues to rise, jumping to nearly 4% on a year over year basis.

Goods inflation (and industrial commodities) are rising due to manufacturing backlogs caused by shutdowns and the overall shift to at-home goods consumption and away from services consumption.

3/ Image
Read 5 tweets
12 Jan
Private inventories to GDP are rock bottom

This is because of a sudden & forced shift to at home goods consumption that caught everyone offsides

The restocking upturn is set to continue

Once the industrial upturn runs it's course, we'll be back to the same old trends

1/ Image
There's been a secular trend of services consumption growing faster than goods consumption.

2/ Image
That trend shifted suddenly but is unlikely to last for years after the economy re-opens. This shift is likely temporary and a result of forced lockdowns, fear of consumer-facing businesses, etc.

3/ Image
Read 7 tweets
4 Jan
Consensus continues to conflate the inflation story, mixing and matching long-term and short-term charts to fit what is generally a secular inflation narrative.

Here are my two cents to make the distinction clear.

1)
There are long-term, secular trends in inflation driven by trend economic growth, monetary policy & fiscal policy.

There are also short-term trends in inflation that are driven by the ups and downs in the manufacturing industry.

2)
If we look at any of the critical long-term monetary variables, a secular shift in inflation is not yet in the cards.

The money multiplier "m" continues to fall which means the new money supply is coming from fiscal spending (finance day to day needs) and QE from non-banks.

3) Image
Read 11 tweets
30 Dec 20
US Dollar Trends

The Fed Trade Weighted Dollar Index fell another 1% over the past month.

The decline was led by the dollar falling against advanced economies as the dollar was down less against emerging market economies

1)
The Fed's trade-weighted indexes are my preferred US dollar aggregates, far better than popular measures like the $DXY due to the concentration

The USD is down 7% across the board in the last six months.

2)
Surprisingly, the USD is still up on the year relative to EM economies

With exceptions, the USD moves counter to global industrial growth

An industrial boom generally puts downward pressure on safe-haven dollars in exchange for more risk while economies are accelerating

3)
Read 8 tweets
29 Dec 20
Diminishing Marginal Returns

The productivity of our debt is collapsing and that is creating a major problem.

The problem is here now, and not in the future.

Here is why:

1)
Charted below is the increase in total debt and the increase in nominal GDP in the 8 quarters before each of the last six recessions.

In other words, how much did debt increase, and how much did GDP increase in the final two years of each economic expansion?

2)
As the chart shows, it is taking a larger amount of debt to increase GDP.

3)
Read 10 tweets
28 Dec 20
M1 money supply is rising at nearly 70% year over year

What is going on and does this mean inflation is coming?

Shorter Answer: No

Longer Answer: Not from the monetary channel

1)
Money supply started to accelerate at the end of March, almost 9 months ago

Inflation was the concern at the time.

"Not in the short-term" but over the long-run was the phrase

9 months later & inflation is lower than when the pandemic started because velocity collapsed

2)
There is a cyclical upturn ongoing in the manufacturing sector which is giving rise to "goods" inflation but that is wholly separate from the (lack of) inflation emerging from the monetary channel that many fear with posts of M1 or M2 money growth.


3)
Read 12 tweets

Did Thread Reader help you today?

Support us! We are indie developers!


This site is made by just two indie developers on a laptop doing marketing, support and development! Read more about the story.

Become a Premium Member ($3/month or $30/year) and get exclusive features!

Become Premium

Too expensive? Make a small donation by buying us coffee ($5) or help with server cost ($10)

Donate via Paypal Become our Patreon

Thank you for your support!

Follow Us on Twitter!