The lastest @PHE_uk surveillance report has been published.

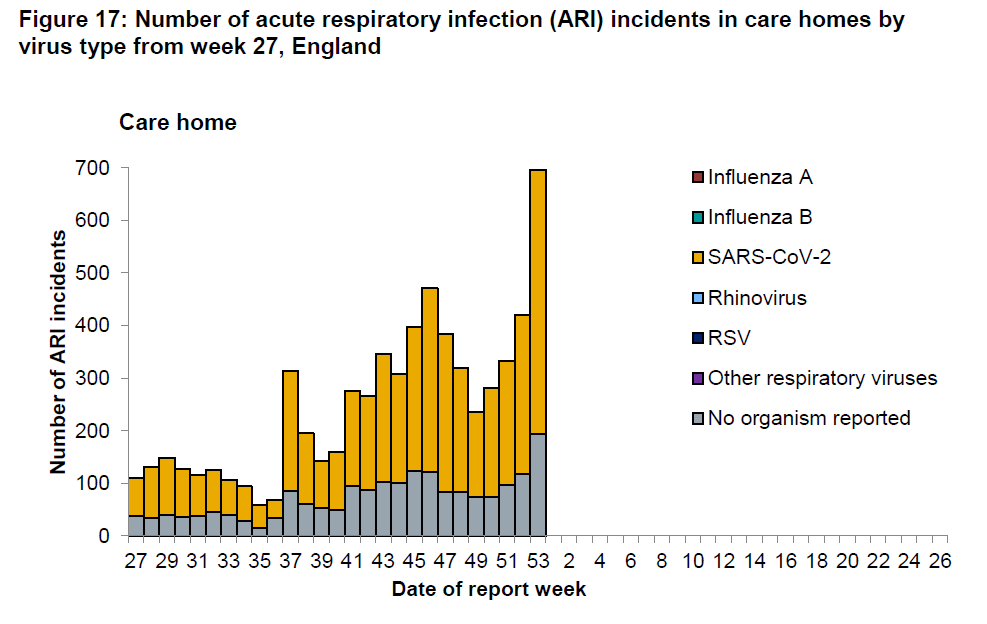
Care home outbreaks/incidents have increased significantly.

assets.publishing.service.gov.uk/government/upl…
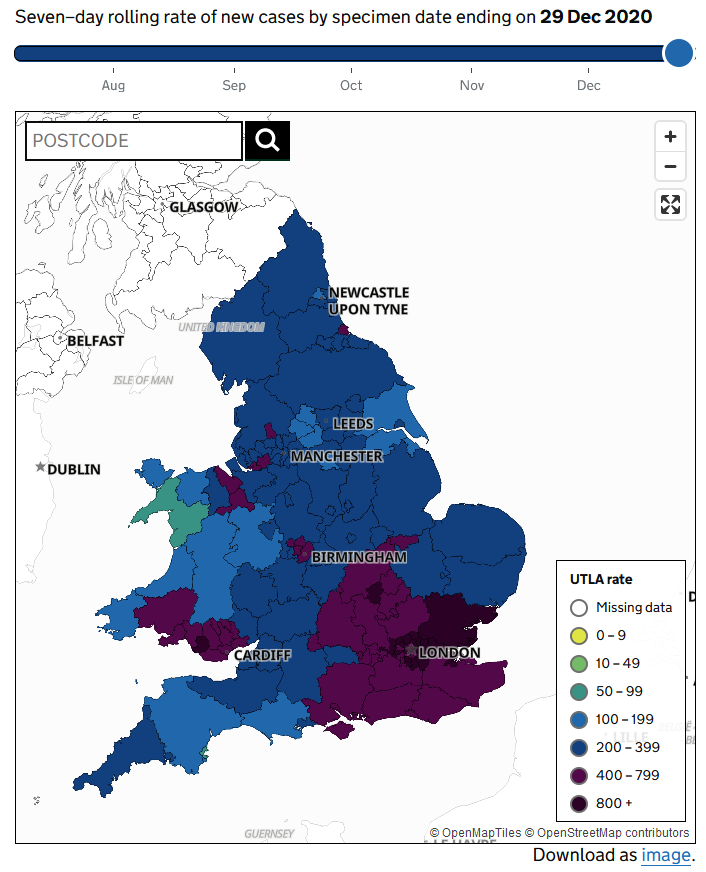
Cases are increasing in all areas of the country
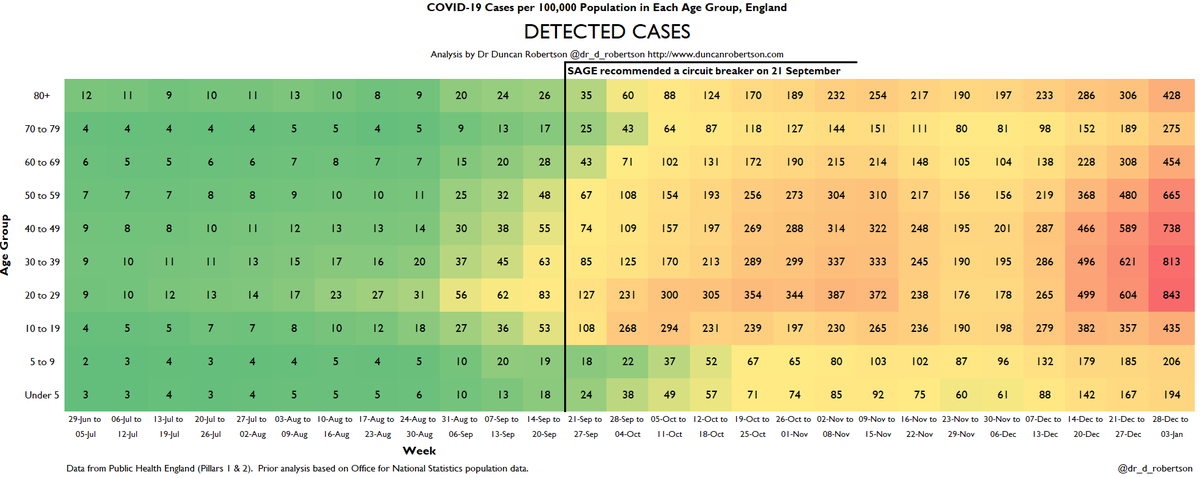
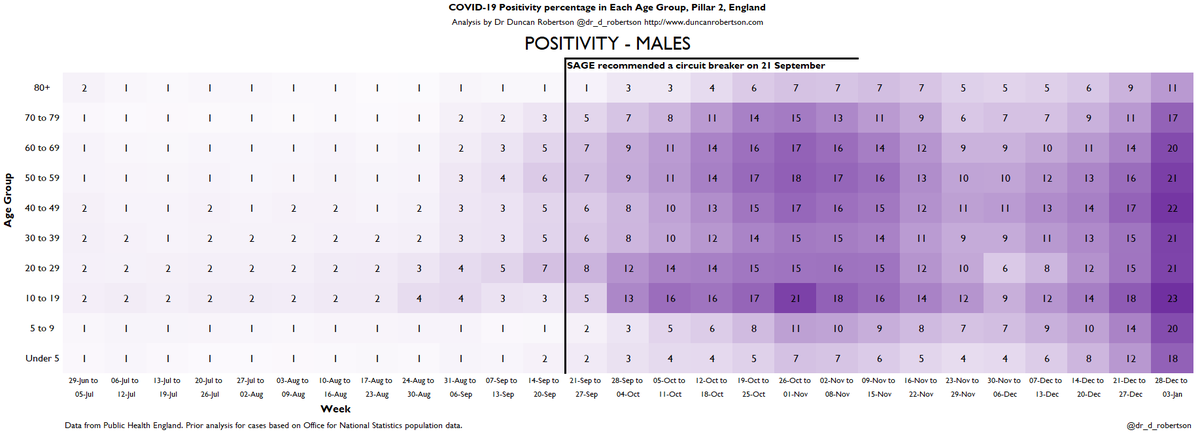
Here is a summary of detected cases.
An excellent summary of the PHE report is here:
Heatmaps from the PHE data available here:

• • •

Missing some Tweet in this thread? You can try to force a refresh
 

Keep Current with Dr Duncan Robertson

Dr Duncan Robertson Profile picture

Stay in touch and get notified when new unrolls are available from this author!

Read all threads

This Thread may be Removed Anytime!

PDF

Twitter may remove this content at anytime! Save it as PDF for later use!

Try unrolling a thread yourself!

how to unroll video
  1. Follow @ThreadReaderApp to mention us!

  2. From a Twitter thread mention us with a keyword "unroll"
@threadreaderapp unroll

Practice here first or read more on our help page!

More from @Dr_D_Robertson

9 Jan
The Government is making the same mistakes as it did in the first wave. Except with knowledge.

A thread. Image
The Government's strategy at the beginning of the pandemic was to 'cocoon' the vulnerable (e.g. those in care homes). This was a 'herd immunity' strategy. This interview is from March.

This strategy failed. It is impossible to 'cocoon' the vulnerable, as Covid is passed from younger people to older, more vulnerable people.

We can see this playing out through heatmaps. e.g. these heatmaps from the second wave.

Read 17 tweets
8 Jan
It is interesting to produce charts today that were presented at the first Number 10 press conference of the first lockdown.

Here are slides from the first press conference on 30 March and their equivalent today.

And a short thread on where we are now.

gov.uk/government/pub…
Transport use - March 2020 Image
Transport use - January 2021

Much higher than the first lockdown. Image
Read 13 tweets
7 Jan
Here are the heatmaps for Covid detected cases, positivity, hospitalizations, and ICU admissions. This is for the week to 3 January 2021.

I have marked a line on 21 September, when SAGE recommended a circuit breaker, so you can see how the situation has deteriorated since then. Image
Detected cases increasing significantly in all age groups (colour and monochrome version).

(The vertical line is 21 September when SAGE recommended a circuit breaker.) ImageImage
Positivity for males. Increasing in each age group.

(The vertical line is 21 September when SAGE recommended a circuit breaker.) Image
Read 8 tweets
7 Jan
Since the March lockdown, there have been a number of changes to the list of who can go to school.

For instance, children with a 'lack of devices' 'should attend school'

The rollout of laptops was promised in the first lockdown. What happened to that? Image
In addition, hundreds of thousands of university/HE lecturers and support staff are now classified as 'critical workers'. Some of course are critical. Some less so. Image
So, we have extra pressure on school places. This will allow the virus to spread.

Government policy should be systematic.

Individual Government departments will want to maximize their own interests.

The PM and Cabinet are responsible for these trade offs and overall policy.
Read 5 tweets
5 Jan
The PM has set an ambitious vaccination target - around 12,000,000 first doses in around 6 weeks. But what happens if instead of 2 million doses per week we have 300,000 per week (current rate)?

This happens.

We need to get vaccinations into people. Not 'hopes' Image
This is the wording from the PM's statement yesterday and is the source of the rough calculation above.

It's odd that this is phrased as 'the NHS hopes'.

What does the *PM* 'hope'? As it is DHSC/ CO/ BEIS/ Vaccine Task Force who are responsible for *procuring* these vaccines. Image
Read 5 tweets
3 Jan
Case rates now and 3 months ago when SAGE suggested a 'circuit breaker' news.sky.com/story/coronavi…

Data from coronavirus.data.gov.uk

A short thread.
22 September: the day after the SAGE meeting.

6,300 cases (7 day average)
354 patients admitted to hospital (7 day average)
1,634 patients in hospital (7 day average)
204 patients in mechanical ventilation beds (7 day ave)
34 deaths/day (7 day ave, within 28 days of +ve test)
20 October

21,866 cases
1,251 patients admitted to hospital
8,499 patients in hospital
733 ventilated patients
217 deaths/day
Read 7 tweets

Did Thread Reader help you today?

Support us! We are indie developers!


This site is made by just two indie developers on a laptop doing marketing, support and development! Read more about the story.

Become a Premium Member ($3/month or $30/year) and get exclusive features!

Become Premium

Too expensive? Make a small donation by buying us coffee ($5) or help with server cost ($10)

Donate via Paypal Become our Patreon

Thank you for your support!

Follow Us on Twitter!