It is interesting to produce charts today that were presented at the first Number 10 press conference of the first lockdown.
Here are slides from the first press conference on 30 March and their equivalent today.
And a short thread on where we are now.
gov.uk/government/pub…
Here are slides from the first press conference on 30 March and their equivalent today.
And a short thread on where we are now.
gov.uk/government/pub…
Transport use - March 2020 

Transport use - January 2021
Much higher than the first lockdown.
Much higher than the first lockdown.
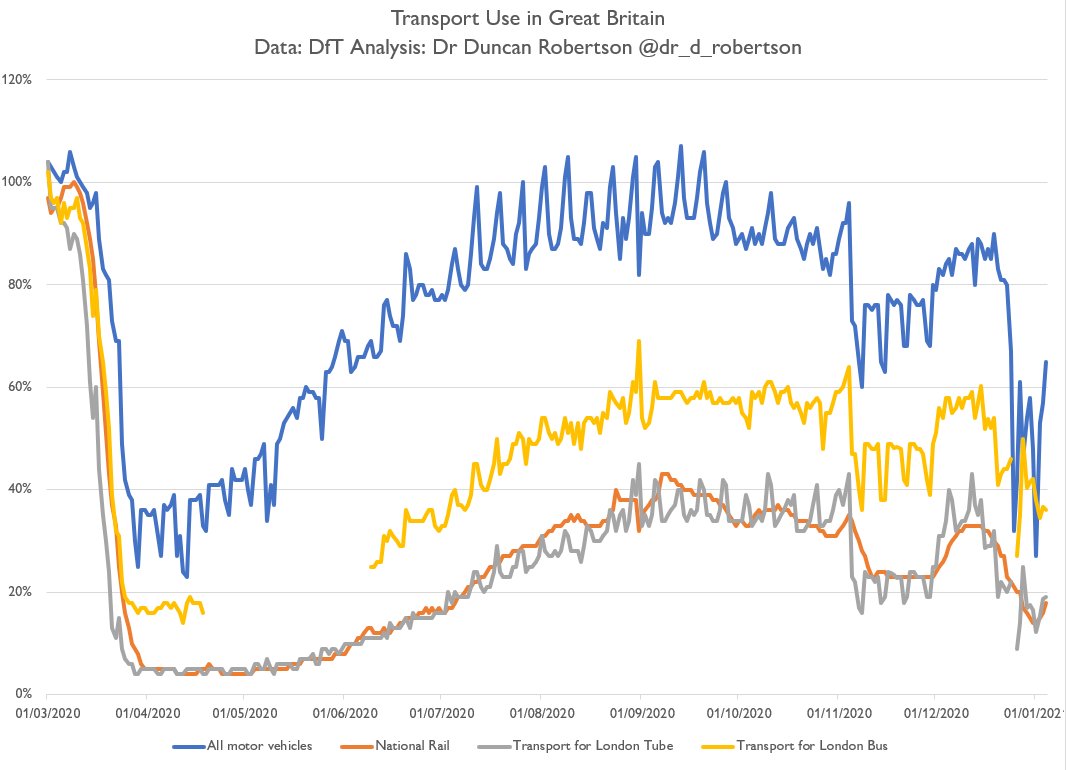
Transport use - January 2021
(Citymapper London data)
(Citymapper London data)
https://twitter.com/Dr_D_Robertson/status/1347178645484425217
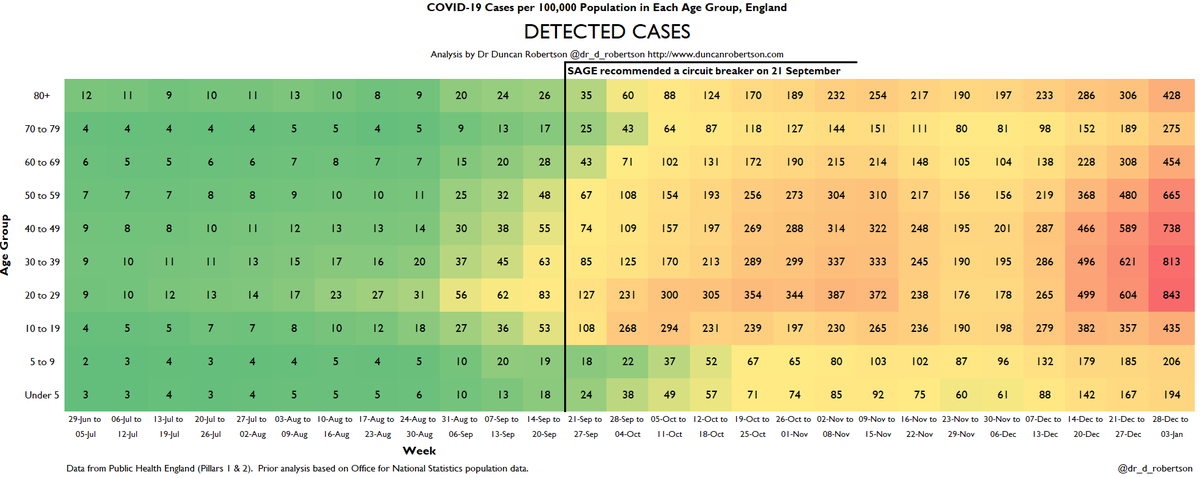
New UK cases - March 2020

New UK cases - January 2021
33.8% increase week on week
33.8% increase week on week

Hospital Admissions - March 2020

Hospital Admissions - January 2021
37% increase week on week.
37% increase week on week.

Global comparison of deaths - March 2020

Global comparison of deaths - January 2021 (source: FT). Only 6 countries shown. US much higher (these are total deaths, not per 100,000)


There are worrying signs that this lockdown is not being observed as strictly as in Lockdown 1.
Some of this is down to Government policy.
Some of this is down to Government policy.
https://twitter.com/Dr_D_Robertson/status/1347154245636730881
The Chief Medical Officer has implored us to take this lockdown very seriously.
I add my voice to this plea.
All of us - including politicians and commentators - have a part to play.
I add my voice to this plea.
All of us - including politicians and commentators - have a part to play.
https://twitter.com/Dr_D_Robertson/status/1347494609501515777
• • •
Missing some Tweet in this thread? You can try to
force a refresh